Mapping Tourism – Identifying Hamburg’s most ‘touristy’ areas

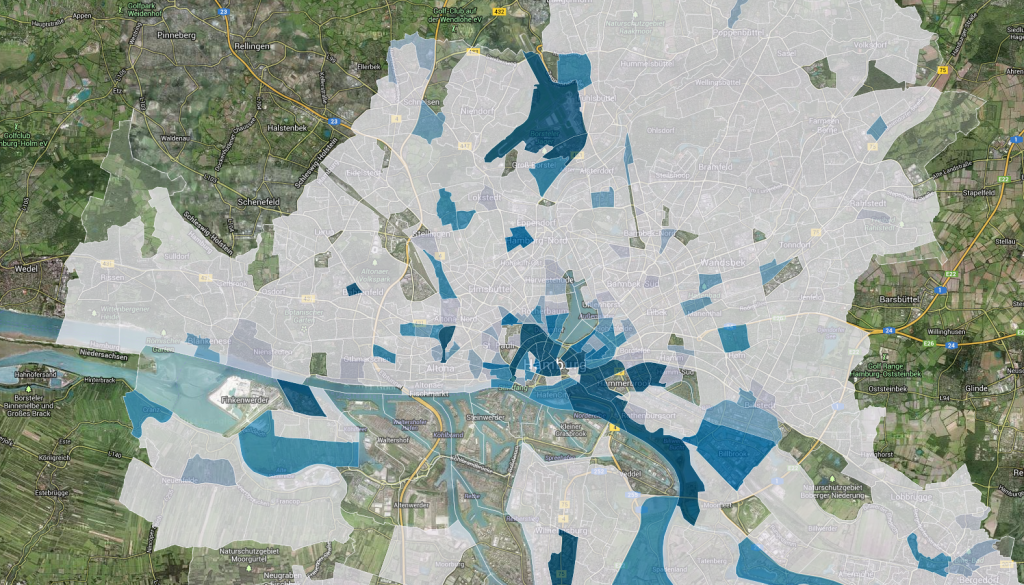
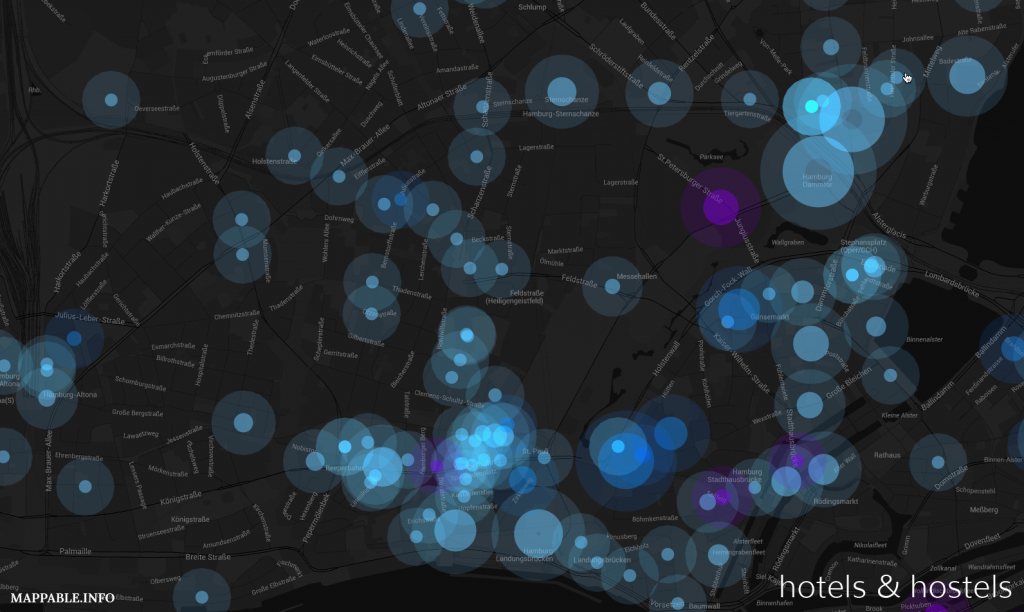
Finally, I found some time to continue working on my mapping tourism project. The first map I published some weeks ago displayed, as you might remember, every hotel & hostel in the city of Hamburg. The map hereby enabled the viewer to get an impression of the spatial dimension of tourism at a glance. Not bad as a starting point. But one of the main reasons tourism has become a topic of public interest in Hamburg recently, is the complaint by some inhabitants that growing tourism is becoming a problem in their neighborhood for various reasons (e.g. noise, traffic, littering). To address these issues too, it was necessary to include an additional aspect in my visualization: population. I’ve thus made a second map, which shows the ratio between inhabitants and tourists on a fine-grained level – in my eyes a very good indicator how ‘touristy’ an area is.

It was’n quite easy to find publicly accessible data for the map. The smallest existing tract shapes (German: statistische Gebiete) are provided by the city of Hamburg, which has opened up this data set as part of their recent open data initiative, which of course is a good thing. The down side is, that this data set is only available via an WFS-Server. A technique, which is not really suitable if you aim at opening up data for the average user. The population data comes from an official  publication by the city of Hamburg, which unfortunately is only available as a pdf-Version, which meant quite some work for me to extract and process the data.

Finally having the data sets at hand, I calculated the number of tourists per area by spatially joining the hotel locations to each tract and counting the sum of provided rooms. The final visualization is once again done in CartDB – this time by using their API, which is way more flexible and allows you to integrate things like a switch between satellite-view and map-view. The final map makes it easy to see which are the most touristy parts of town (marked in blue). You can explore the interactive map by clicking here or on the preview picture below. Both lead to the updated project page, where I also added a new project summary (completely in English now).

Mapping the growth of tourism in Hamburg

Tourism in Hamburg has been substantially and continuously growing during the last decade. The city has reached position ten among the most popular European city destinations last year with more than 10 million overnight stays.

Even tough the topic of tourism growth is drawing increasing public attention, especially when it comes to spectacular projects like the new concert hall ‘Elbphilharmonie‘ or the plans to build a cable car over the river Elbe, I’ve never come across a good visualization on that issue. Which, at least in my eyes, is quite astonishing, as most of the underlying information like hotel addresses or tourist attractions is space-related.

This is where I got started with my just for fun side project. I collected data of hotel locations, categories, years of construction and number of rooms from the free, crowd-sourced database hotelsbase. After quite a lot of data wrangling and searching further details from various hotel- and hotel-booking websites, the only thing missing was information about current building projects. Fortunately there is an up-to-date overview of hotel projects provided by Hamburg travel.

Finally, the fun part about the whole thing was visualizing the collected information by using CartoDB. A really powerful, yet easy to use web-based mapping platform. A big recommendation, even for those of you who are not too familiar with mapping. I started by showing the hotel locations on a dark base-map. In order to visualize the different hotel sizes and years of construction I made further adjustments to the default map style. As a result it is now quite easy to recognize which hotels were built in the last five years (marked in dark blue) and which are currently planned or under construction (purple).

You can explore the final and fully interactive map here.  Furthermore there is a more in depth analysis of the identified patterns and some additional interpretation (unfortunately only in German). I’m quite curious how people will react to this relatively abstract, but spatial perspective on tourism growth in Hamburg.