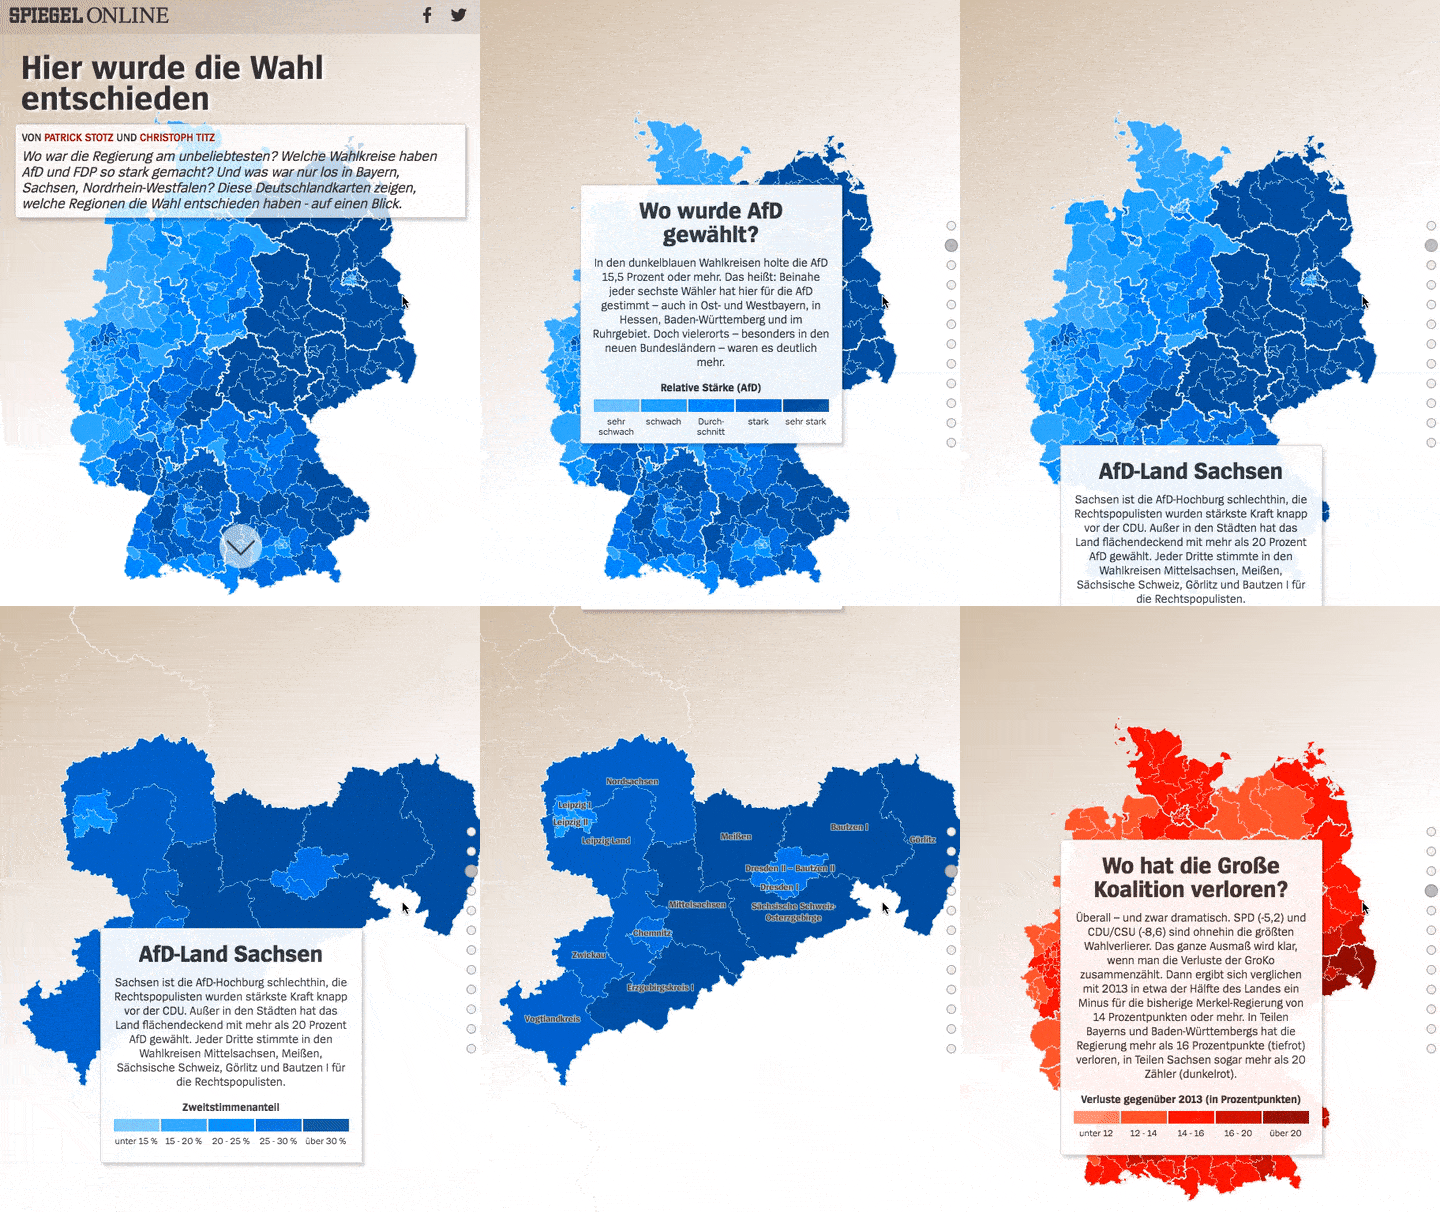
Back in September, we published this scrollytelling map covering the German Federal Election on Spiegel Online:

I want to share a few thoughts about it because we did some things differently on this project:
Most importantly, we decided to explain the election results to our readers solely by guiding them through a series of annotated choropleth maps. Chapter by chapter, maps and text side by side but without any interaction, except moving on by scrolling. Of course, there was a dashboard-like view on our site while the results came in on constituency level. But we wanted to give more context. Really explaining what happened where by pointing out pivotal points for different parties and regions. Making the most of the spatial information contained in election data by knitting together maps and story and really guiding our readers.
Why using MapboxGL
The basic principle of the map is very simple. Constituencies are shown in a series of choropleth maps (based on different properties and thresholds), with occasional labels and viewport changes.
Out of the various options to realize this setup, we chose MapboxGL, using WebGL for the first time in one of our projects.
This approach offered several advantages over the classic pre-rendered map tile workflow. Most importantly, the vector data setup allowed us to use a single data set (containing all necessary information on a constituency level as feature properties), rendering the different styles for each slide/map on the client side. This lead to reduced file size (vector data has to be queried only once) and made updating data during election night very convenient.
Additional benefits when using MapboxGL where the smooth zoom animation and freely defined zoom levels, that fit the bounds on devices of different size. A small downside was, that we had to build a fallback option for readers with outdated browsers or devices.
Scrollytelling tools FTW
In order to build a story out of the individual maps and the accompanying text, we needed a solution that kept both elements close together. Luckily there are various scrollytelling libraries for this purpose that make position handling and derived interactions in JavaScript really easy. This blogpost by Russel Goldenberg is a great overview of the different options and their pros and cons.
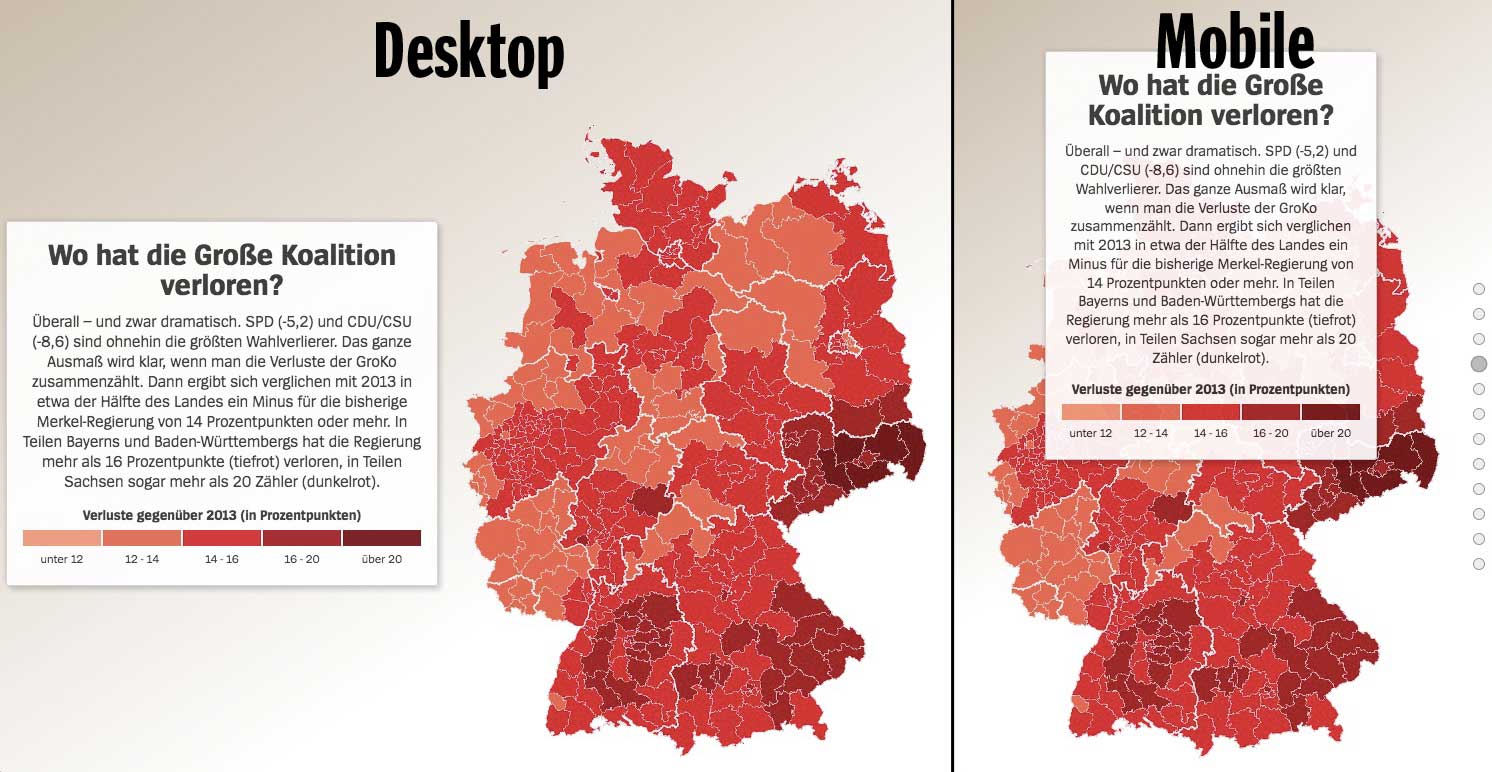
We build our project based on waypoints.JS and put our text in boxes of up to roughly 500 characters each (+ HTML-legend) that scrolled on top of the sticky map. On wider displays the text moves to the side, customized by a few simple CSS media queries.

Workflow
Of course, a project like this can’t be put together on deadline without preparation. I started building a prototype around two weeks before the election. The underlying data came directly from the German Federal Returning Officer who released constituency geometries upfront and preliminary election results in a pre-defined format during election night. All that was left to do during the election night was defining the storyline, styling individual maps, writing the text sections (my colleague Christoph Titz helped me out with that) and putting everything together. I won’t claim it wasn’t stressful, but the map was finished around seven hours after we had gotten the preliminary results.