Analogue Mapping

A few weeks ago I stumbled across a Youtube video in which a globe was cast out of cement and then painted. I’ve been thinking about making my own globe for quite some time (not just since I’ve known the great globes from Bellerby Globemakers in London), so I tried my luck.
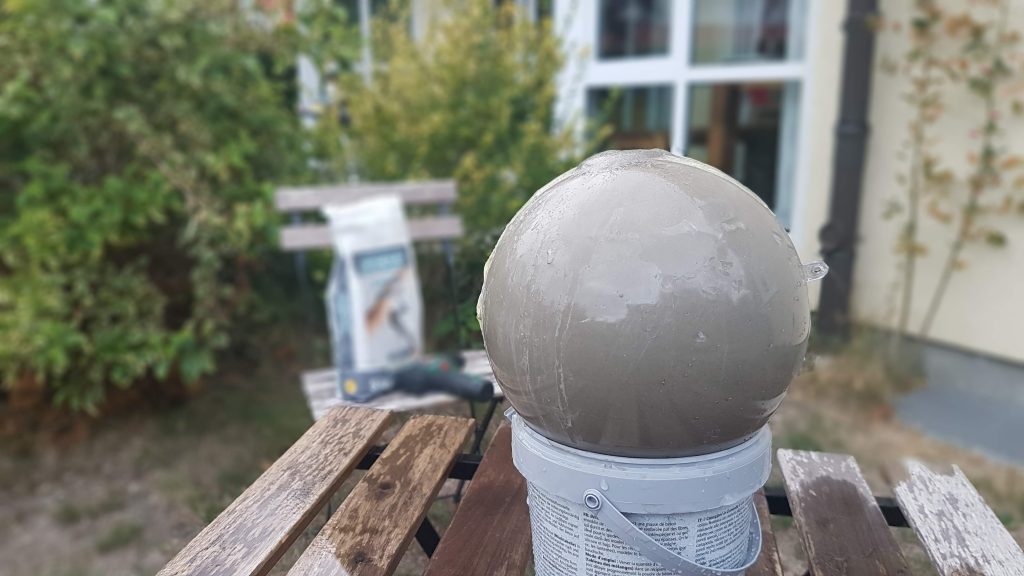
freshly cast globe

In the first step of the process, I greased the mould of a Christmas tree ball from a craft shop and filled it with fresh cement through a hole in the upper part.
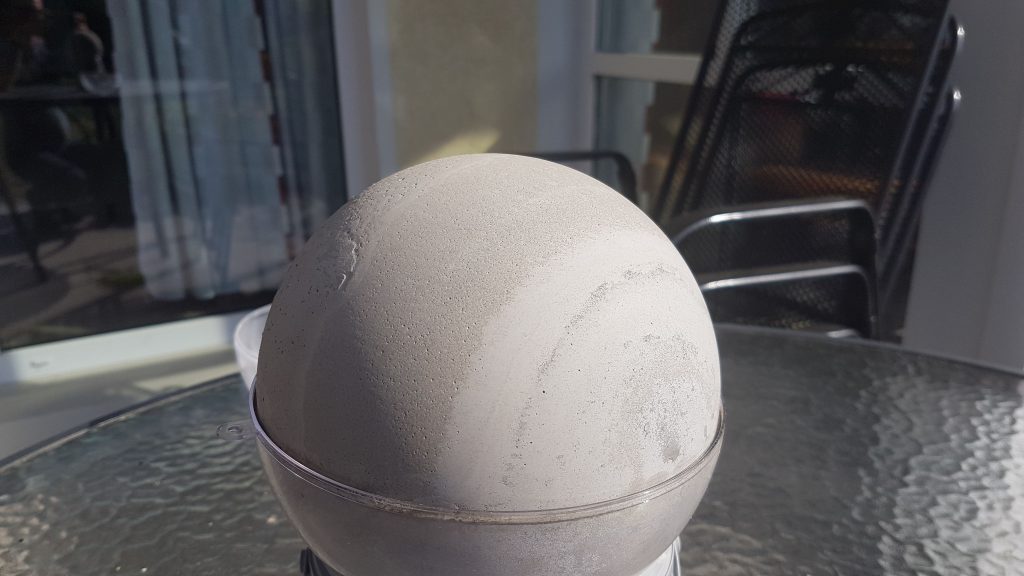
dried cement still inside half of it’s mould

Due to the material of the mould, the drying process took a very long time. Only after about one day could I remove the upper half of the mould and let the globe dry well. The texture of the sphere reminded me a little of Jupiter or Neptune – maybe a good idea for the next project.
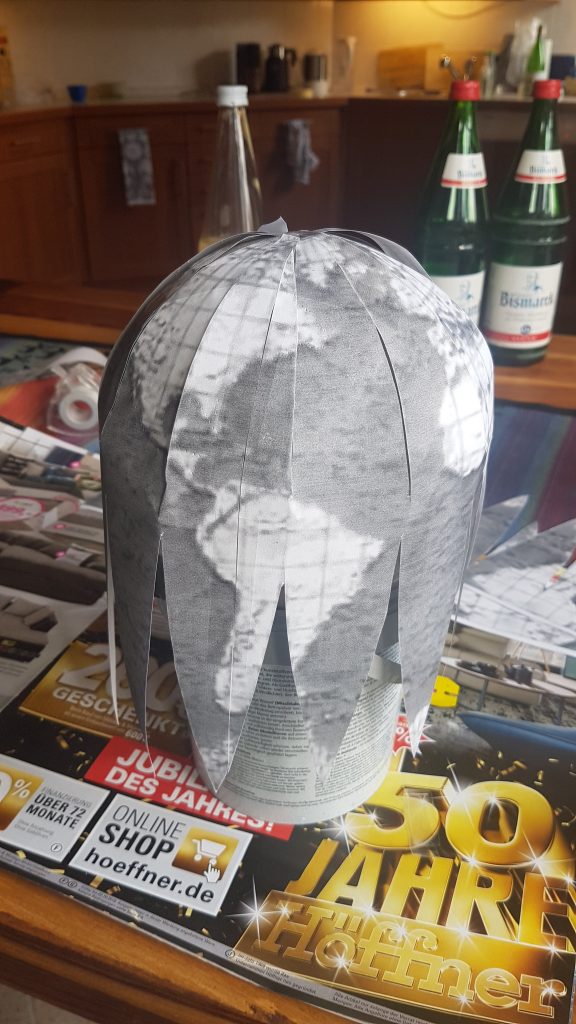
paper stencil
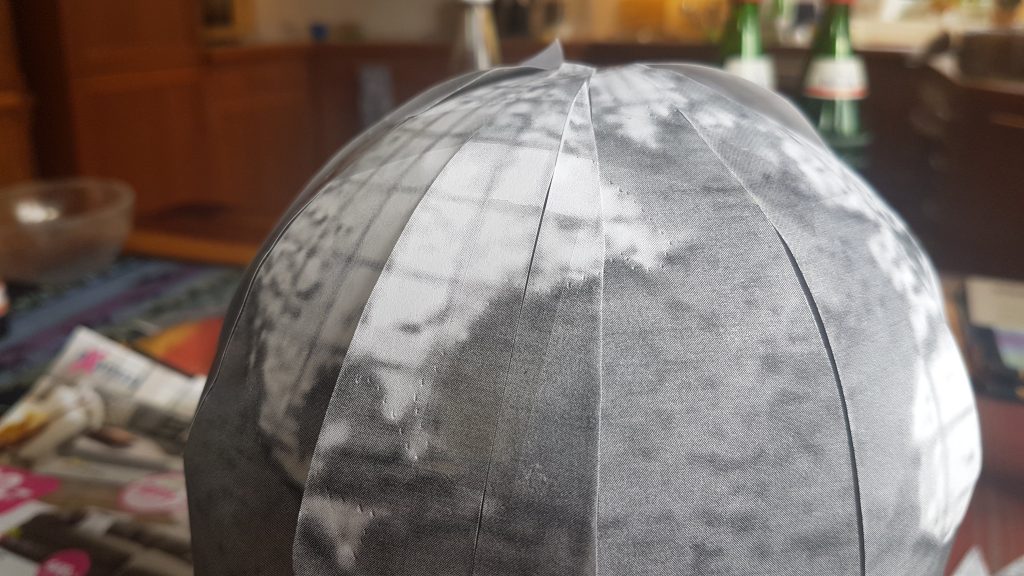
stencil detail

Every cartographer knows that it is not easy to bring the continents that exist as a sphere into a flat projection. The other way around, too, you have to do some tinkering. It was nice to find some templates for paper globes on the net, which I could then print and transfer as well.
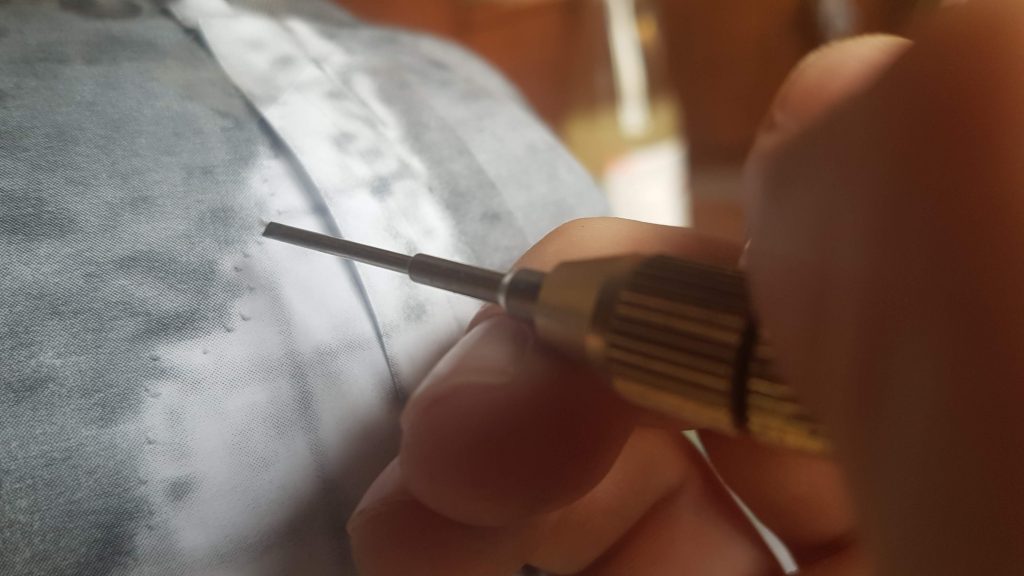
transfer work

At first I tried to draw the continents through the paper with a pencil, but it didn’t work well. So I decided to use a thin screwdriver to scratch the not yet completely hard cement. This worked surprisingly well.
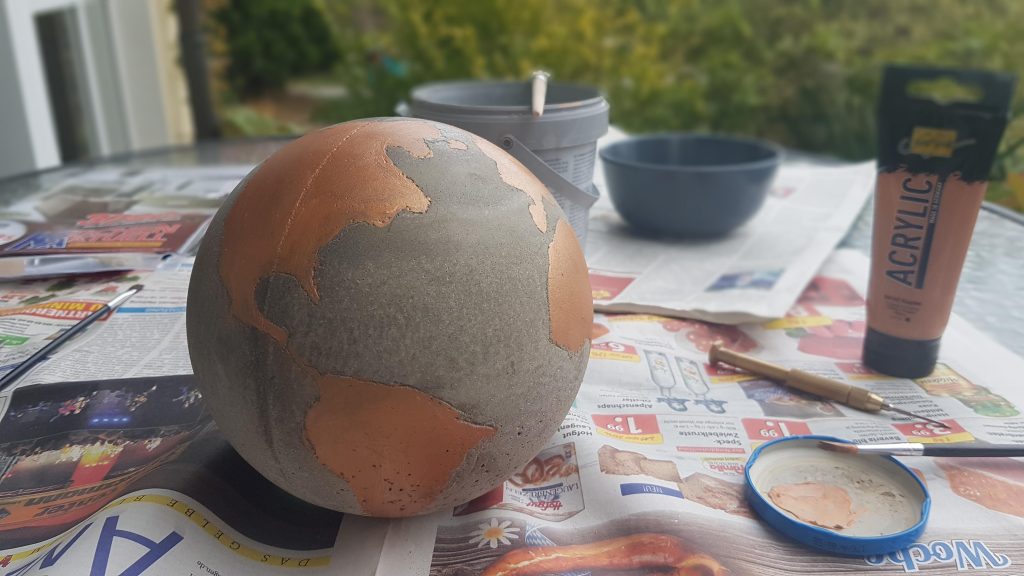
copper paint job

In the end all I had left to do was to paint the continents with an acrylic paint. I decided to use copper, which goes well with the mottled grey globe. The finish was a layer of clear varnish over the ball, because the cement was still a bit crumbly to the touch.
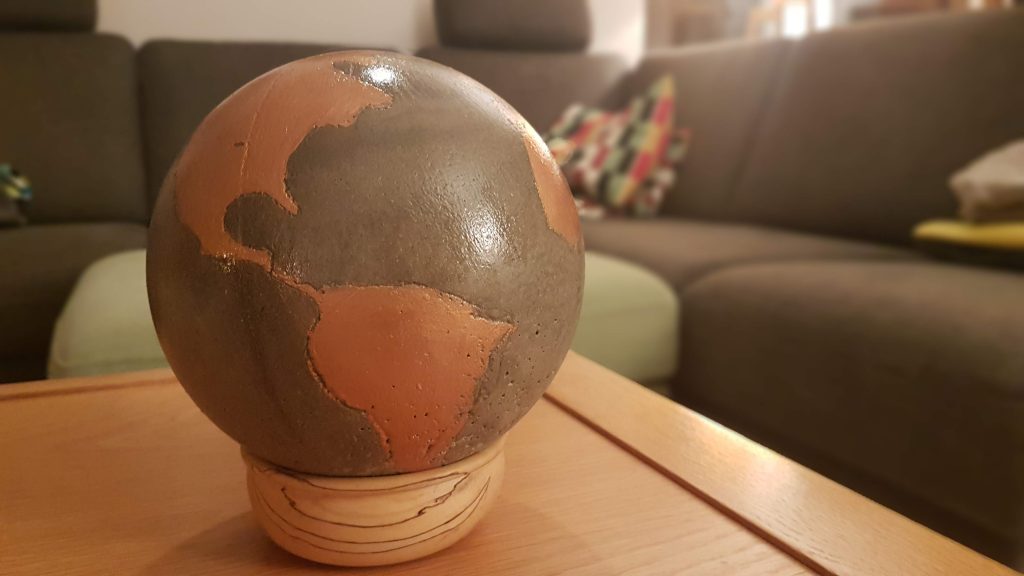
the final globe

I’m quite happy with the final globe (the clear varnish is now much matter than in the photo above), even though it can’t compete with a purchased product. But it was a great fun and maybe I’ll build some more and improved versions sometime.
Since there were some questions: It weighs about 1,5 kg and cost about 20€ of material (cement, shell, acrylic paint and clear varnish).
Scrollytelling with MapboxGL & waypoint.JS

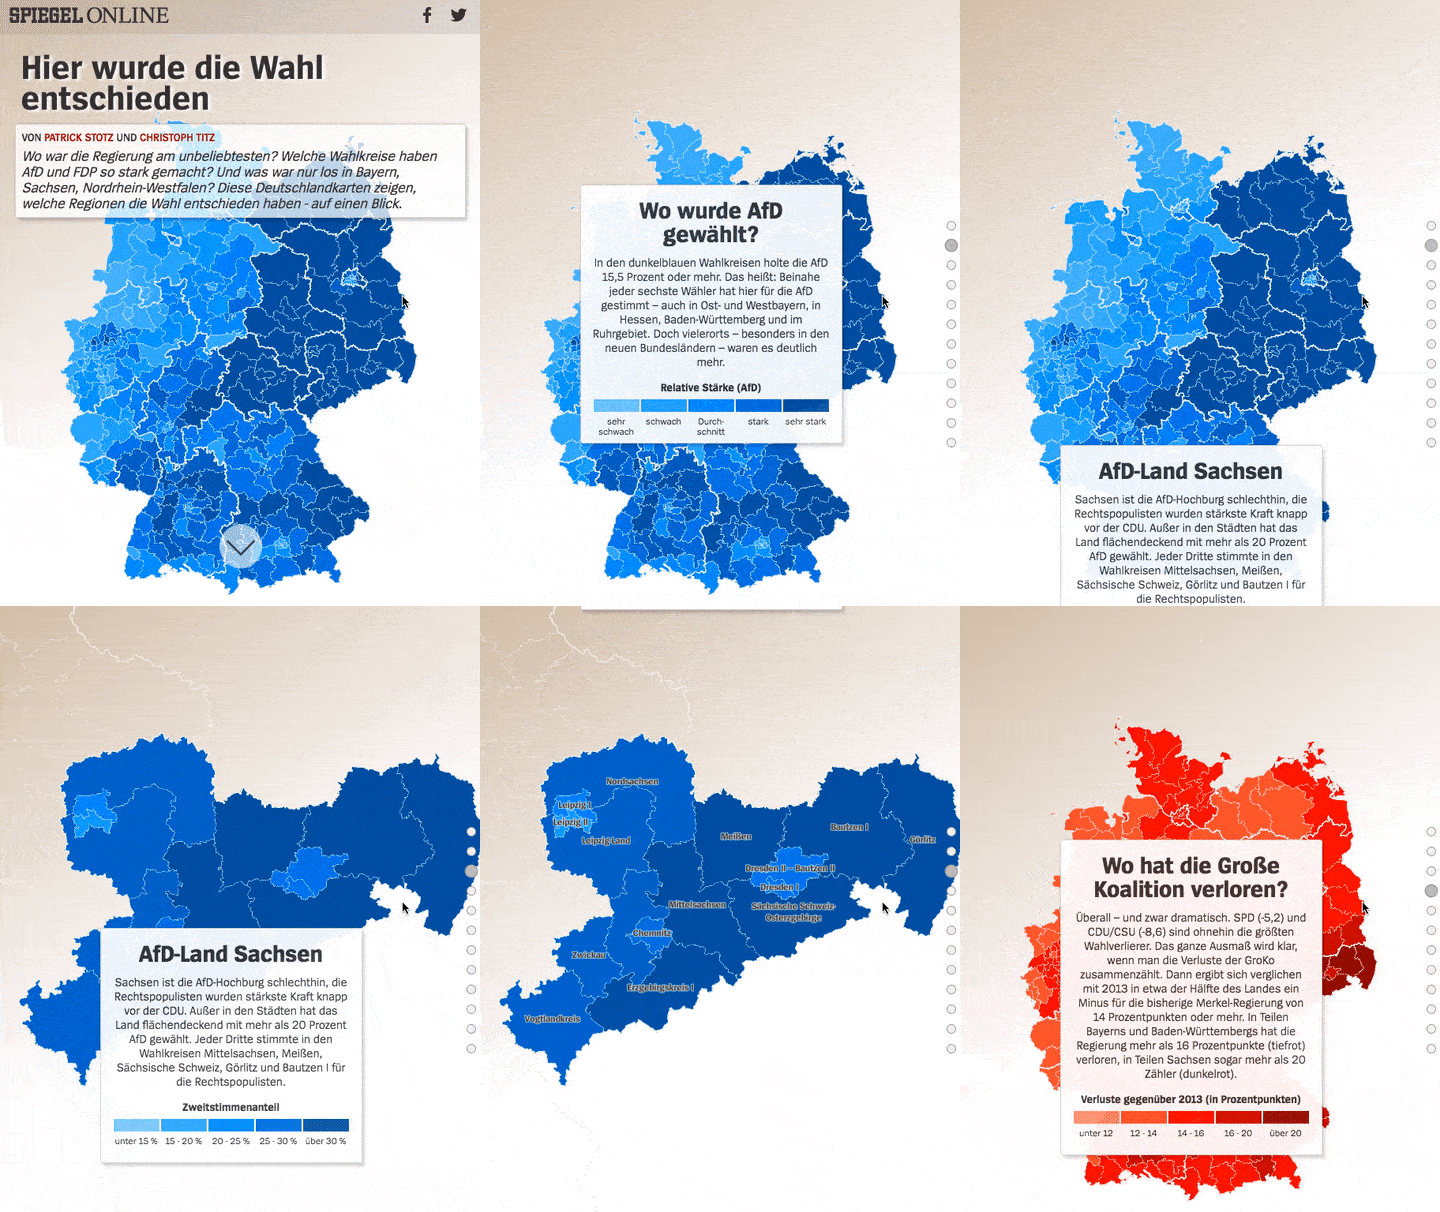
Back in September, we published this scrollytelling map covering the German Federal Election on Spiegel Online:

I want to share a few thoughts about it because we did some things differently on this project:

Most importantly, we decided to explain the election results to our readers solely by guiding them through a series of annotated choropleth maps. Chapter by chapter, maps and text side by side but without any interaction, except moving on by scrolling. Of course, there was a dashboard-like view on our site while the results came in on constituency level. But we wanted to give more context. Really explaining what happened where by pointing out pivotal points for different parties and regions. Making the most of the spatial information contained in election data by knitting together maps and story and really guiding our readers.

Why using MapboxGL

The basic principle of the map is very simple. Constituencies are shown in a series of choropleth maps (based on different properties and thresholds), with occasional labels and viewport changes.

Out of the various options to realize this setup, we chose MapboxGL, using WebGL for the first time in one of our projects.

This approach offered several advantages over the classic pre-rendered map tile workflow. Most importantly, the vector data setup allowed us to use a single data set (containing all necessary information on a constituency level as feature properties), rendering the different styles for each slide/map on the client side. This lead to reduced file size (vector data has to be queried only once) and made updating data during election night very convenient.

Additional benefits when using MapboxGL where the smooth zoom animation and freely defined zoom levels, that fit the bounds on devices of different size. A small downside was, that we had to build a fallback option for readers with outdated browsers or devices.

Scrollytelling tools FTW

In order to build a story out of the individual maps and the accompanying text, we needed a solution that kept both elements close together. Luckily there are various scrollytelling libraries for this purpose that make position handling and derived interactions in JavaScript really easy. This blogpost by Russel Goldenberg is a great overview of the different options and their pros and cons.

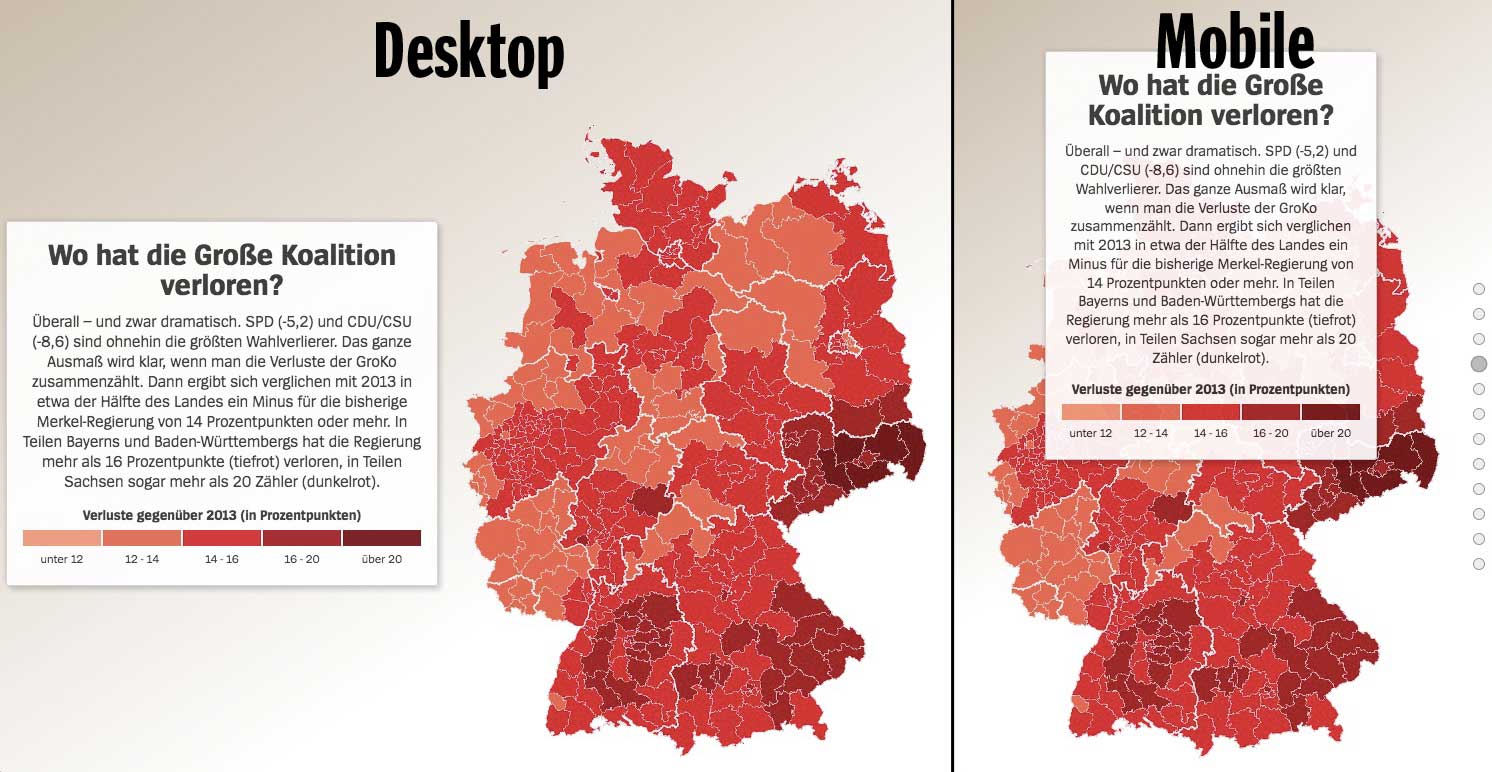
We build our project based on waypoints.JS and put our text in boxes of up to roughly 500 characters each (+ HTML-legend) that scrolled on top of the sticky map. On wider displays the text moves to the side, customized by a few simple CSS media queries.

Workflow

Of course, a project like this can’t be put together on deadline without preparation. I started building a prototype around two weeks before the election. The underlying data came directly from the German Federal Returning Officer who released constituency geometries upfront and preliminary election results in a pre-defined format during election night. All that was left to do during the election night was defining the storyline, styling individual maps, writing the text sections (my colleague Christoph Titz helped me out with that) and putting everything together. I won’t claim it wasn’t stressful, but the map was finished around seven hours after we had gotten the preliminary results.


drone mapping

Drones are fun… It is hardly news that cartography and remote sensing are moving away from heavy payload carriers such as airplanes and helicopters to smaller, unmanned systems. Commercial UAVs are now used in all kinds of sectors, not just the military.

I have been flying a DJI Spark for a few months now and I’m quite surprised at the quality of this small consumer drone when it comes to mapping. In this blog post I want to outline the drone, my workflow for processing the images and the resulting 3d maps.

With a take-off weight of approx. 300 grams, the Spark is the lightest and smallest drone of the consumer market leader dji from China. I often take it with me in a small backpack and take it out spontaneously for a flight. Flight preparation takes only about one minute: You boot the drone, then the remote control and connect your phone or tablet to the remote control.

To create a 3d scene, I fly several times around the object of my interest in a constant height and take about 50 photos. The Spark has a flight time of approx. 15 minutes per battery pack, whereby you have to subtract take-off and landing and achieve a realistic duration of 12 minutes per flight. This is sufficient to fly around even complex objects. The battery pack is easily exchangeable (I bought 3 packs so flight time is usually not a problem).

Back home I check the pictures first and delete blurred pictures manually. Then I use 3DF Zephyr, a software to reconstruct 3d models from pictures or videos. The software is quite simple, but has powerful features. Up to 50 images can be loaded and processed in the free version. In contrast to software, which I used in the past, you don’t have to manually set fixed identification points between images any more. The complete reconstruction is fully automatic. At the end, different products such as point clouds, meshes or textured models can be exported. A nice feature is the direct integration into Sketchfab, a service for hosting 3D models on the web.

Sketchfab offers the possibility to manually adjust lighting, color and contrast to create a video game like style for the models that I believe has a nice effect while still providing enough detail about the object.

Of course, not only 3d models are valuable results of a drone flight. Often it is more interesting to create orthophotos from the individual images. I intend to have a look at the Open Drone Mapping Project in the coming months and will report on the results.

Until then: Happy flying!

its / db mobility hackathon 2017

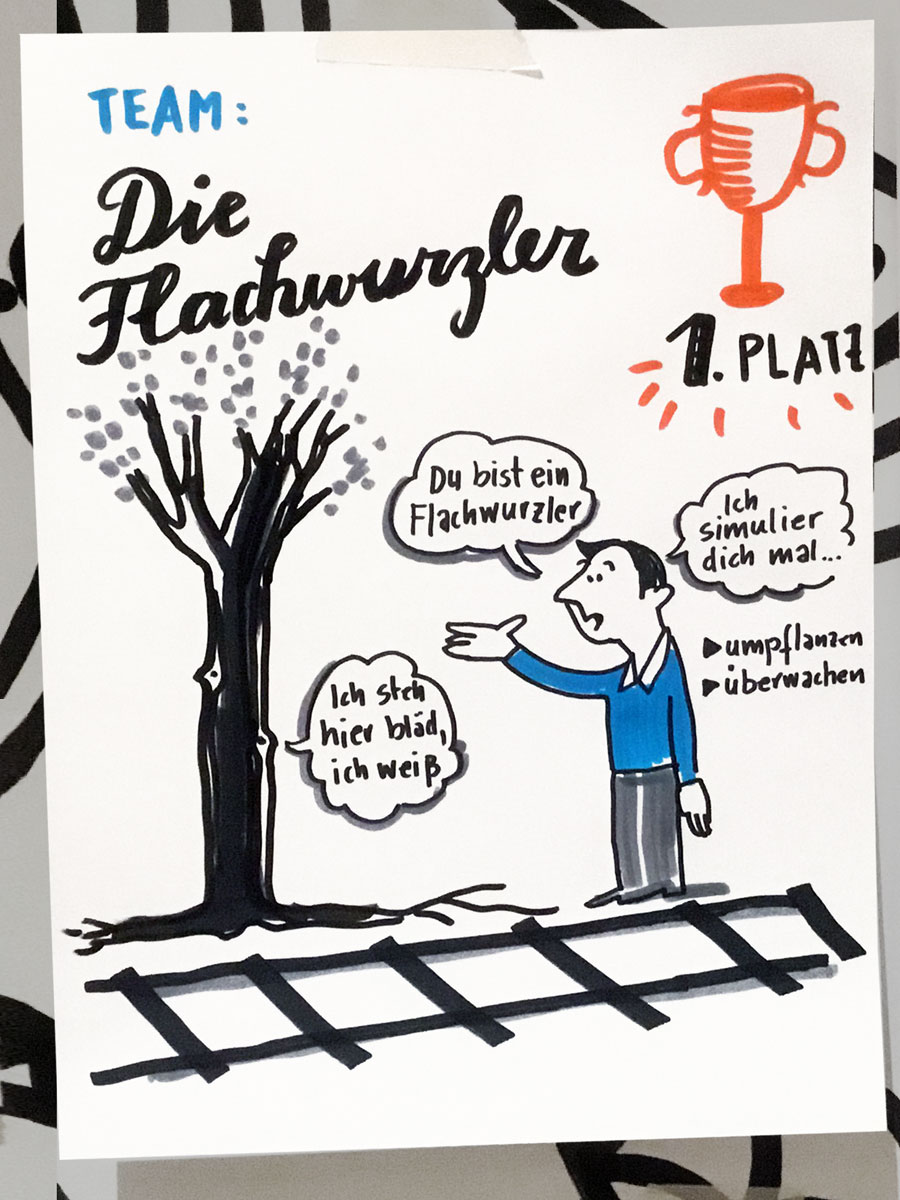
Our team consisting of four civity analyst took part in the DB / ITS Hackathon in Hamburg on Friday / Saturday and won the first place quite unexpectedly…

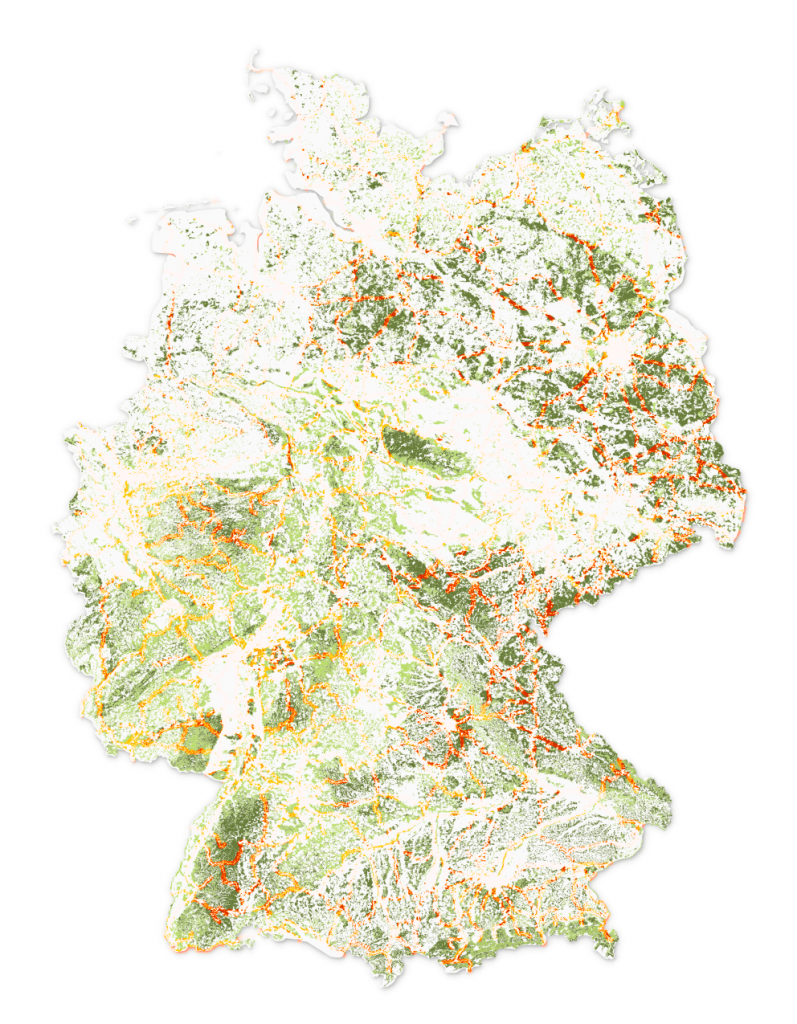
On a hackathon, a programming project / data analysis has to be developed from the idea to the prototype within 24 hours. We opted for the relatively current topic of “storm susceptibility of the rail infrastructure due to falling trees”. We used a combination of different methods and open datasets to create static and interactive maps to identify hot-spots within the German rail system in general and the Hamburg system in particular.

Storm risk analysis of the German railway system. Red and yellow lines indicate a heightened risk for trees falling onto the railway tracks.

You can find the finished project here: http://46.101.153.57/ 

Pictures and further information can be found at: https://dbmindbox.com/db-opendata-hackathons/hackathons/hamburg/

Let’s start blogging again

It’s been quiet here on mappable for much too long (891 days to be precise, this a data nerd blog after all). A lot of things changed since we first got started with mappable in 2013/14. Back then Mapbox and CartoDB were still brand new startups, we had all just stopped talking about google fusion tables and mapping mashups (remember that?) and putting election results on an interactive map was top notch data journalism.
A lot things changed since then. Like so many others in the field of (geospatial) data analysis and visualization, what started as a fun project in our free time grew into ordinary full-time jobs. We’re now both members of Spiegel Online’s data journalism team and Achim is leading a small data team at Hamburg/Berlin based consultancy Civity.
Unfortunately, spending all day crunching data also ment we’ve stopped write about our work here in our free time. Like a lot of other blogs, mappable.info got silent exactly the moment we’ve made most progress and probably had the most interesting work to share. Being career changers our selves and having learned so much from the open spirit in the geospatial, open source, open data & dataviz communities this is something we want to change again. We probably won’t start bigger projects here but we’ll do our best to write blog posts here every once in a while to keep you updated what we’re working on these days. Stay tuned, there’s more to come soon.

Patrick & Achim

BTW: We’ve switched our web hosts. The blog now runs on wordpress (not too happy about the move though, but we just don’t want to waste time with that any more). We’ve done our best to keep projects up an running, but there might still be some small issues and dead links.