About this Project
One of our main interests at mappable is to find creative ways to use (geo-)data for mapping urban dynamics. In our newest project we will explore how phone directories can serve as a data source for various analytical tasks, starting with urban migration patterns.
Digitized phone books are an interesting datasource and have already been used for scientific purposes like drawing samples in empirical social research or for evaluating the regional frequency of surnames for example. Although we definitely like the idea behind these approaches, we think that there’s a lot more potential in phone directories as a datasource. A potential that can be unleashed by working with exact addresses and the corresponding geo coordinates.
To explore this potential, we bought old German CD-ROM phone directories for the years 2004 – 2012 and exported the datasets for Berlin. Using official house-coordinates it was an easy task to geocode all addresses in the directory. With unique phone number and surname as an identifier we then identified approximately 50.000 individual intra-city relocations.
Interactive Data Explorer
But how to explore 50.000 entries and find patterns within the dataset? Sounds like a classic (explorative) dataviz challenge. As we work with geographic data, making a map was a quite obvious solution. Additionally we just recently stumbled across a visualization of US State Migration Flows by Christopher Ingraham, found on his inspiring blog {WonkViz} which we decided to use as a prototype for our map. Our goal was to integrate interactive elements into the map so people can explore the dataset on their own. Furthermore this was a welcome opportunity to play with D3, the javascript library used for the visualization, which we wanted to integrate in our work for quite some time.
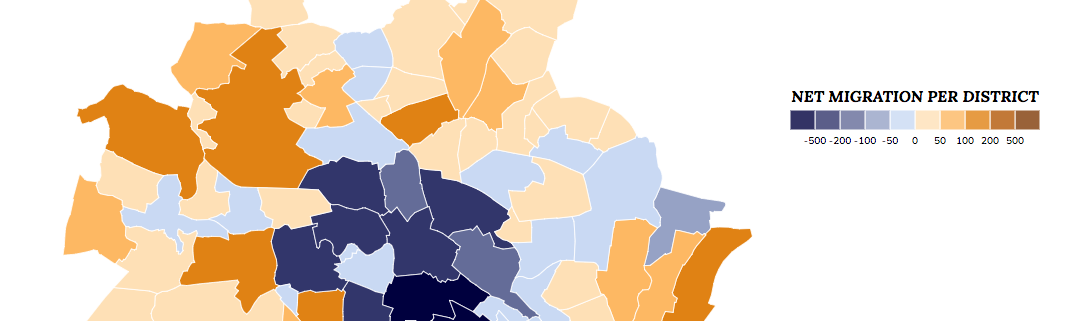
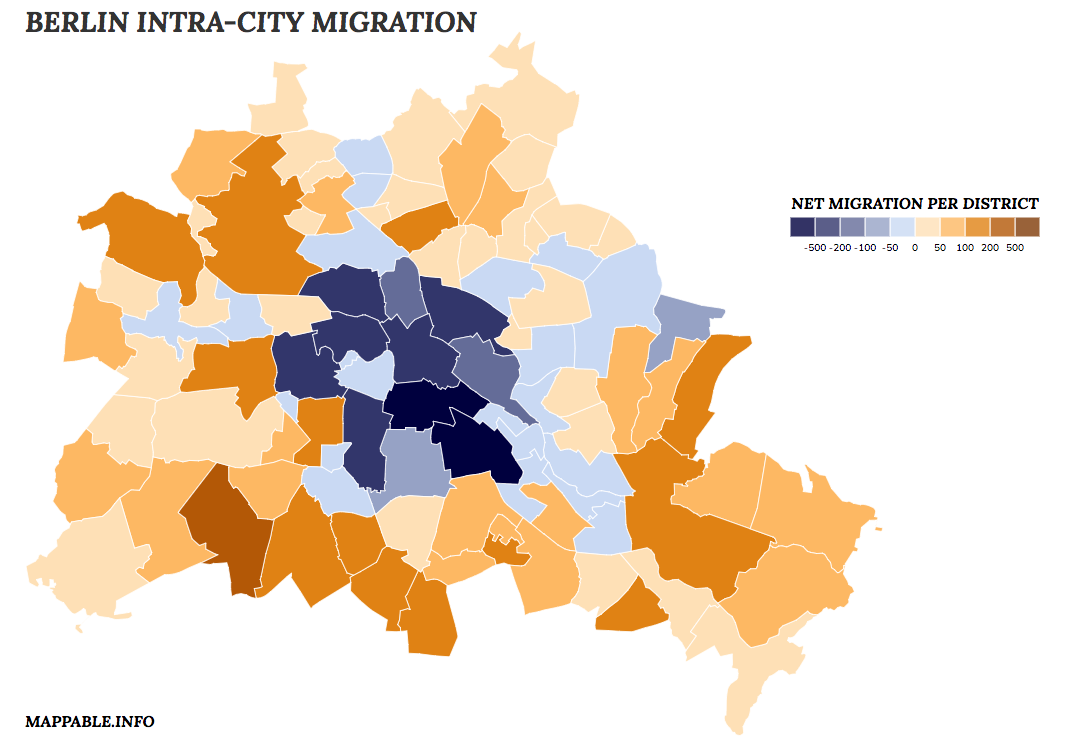
If you want to explore the dataset on your own, just click on the map itself or the caption below to open a larger, interactive version. Effectively the visualization consists of two different maps. One classic choropleth map, showing the net migration per district and one flow map, showing the migration patterns for the currently selected (clicked) district. In case you are interested in the source code of our visualization, take a look at it on github.
Interpretation
Berlin is currently undoubtedly one of Europe’s most trendy cities. You can’t set step into the U-Bahn without meeting tourists from all around the world and every local can tell you stories about the burst of housing and rental prices during the last years. At first we thus were quite surprised to find out, that according to our dataset, all inner-city districts are loosing phone directory entries (households) to the outer districts. How does this come? If you look at some publications about migration patterns of German cities you’ll quickly find out that the attractive and growing cities are growing in population because loads of 18 to 30 year olds are moving into the (mostly inner-)cities for studying and enjoying big city life. In all other age groups even attractive cities are still shrinking in population. This is especially true for the 30 to 40 year olds, who are moving out of the city or to the urban fringe for a more suburban lifestyle (for extensive, scientific coverage of reurbanization in Germany take a look at this monograph).
These trends perfectly explain the migration patterns found in our phone directory dataset. As our current dataset only consists of intra-city migration, it includes all those people moving from the inner-city to the outskirts (as long as they stay within city limits) but it excludes all the young people coming from the rest of Germany or even abroad and who are moving into Berlin’s central districts.
Beyond these first thoughts about how to interpret the found migration patterns there’s one more mentionable fact: The approach we’ve described allows to conduct studies of migration patterns for pretty much any spatial granularity (as long as the population of migrations in big enough). Although we are aware that our approach is a mere indicator and can not function as an official statistical data source, our analysis shows very plausible and consistent migration patterns at the scale of districts (‘Ortsteile’), while the city’s official migration statistics is only published on a county level (‘Bezirke’).
Coming soon / What else could be done with this dataset
- Monitoring gentrification processes on a district or maybe even tract level by in-depth analysis of migration patterns
- Identifying ethnicity patterns by surname distribution
- …any other ideas at what else we should take a closer look? Get in touch with us!
A Peek into the Dataset
According to Wikipedia the first German telephone directory was issued on 14th of July 1881 and listet only 185 entries. In 1990 the German Post was first to offer a nationwide telephone directory on CD-ROM – with a DM 3,300 (roughly 1,700€) price tag on it, which of course fell sharply in the late 1990s. Today the digital phone directories are mostly internet-based although the CD-ROM / DVD versions are still available. Here are some descriptive facts about the dataset we used:
Entries by type
There is no obligation to register in the phone book and in recent years there has been a significant decline in the overall number of entries. The rise of mobile phones has not significantly affected the structure. Their share inside our phone directory dataset rose from 8% to 12% between 2004 and 2010 and kept stable in 2012.
Entries per citizen
The chart to the right shows the number of phone directory entries per citizen. If each citizen had exactly one entry the chart would show the datapoint “1” (which doesn’t make much sense, considering that there’s most only entry per household).
On average the Berlin household consists of 1.73 Persons and the city has a population of roughly 3.3 million. Therefore a complete phone directory of Berlin would consist of at least 1.900.000 entries (which quite exactly matches the official number of housing units and results in 0.58 entries per person). The chart to the reight clearly shows that the dataset is far from this ratio with 0.35 in 2004 and 0.21 in 2012.
Disclaimer:
This project is an attempt to use ‘byproduct data’ in an exploratory research approach. We are well aware of the fact that phone directories are a maybe outdated and definitely incomplete data source. False data points and other errors in the input data sets are inevitable. Although we spent a lot of work to clean up the records, we recommend to deal critically with the results.
Finally, we’d like to mention, that we’ve realized this project in our spare time. It is a strictly non profit, just for fun project and it is not connected to our current employers.