
For our latest project we’ve joined forces with Jakob F. Schmid, research fellow at Hamburg’s HafenCity University, whose research is focussing on the urban night time economy. We had the pleasure to collaborate with him during his research project „Stadtnachacht – Management der Urbanen Nachtökonomie“ (CityAfter8pm – Management of the urban night time economy) by mapping the distribution of night life activity in 13 German cities.
After collecting business listings of relevant categories (nightlife, cinemas, theaters, and event locations) from a popular online directory, the requirements for mapping them were twofold:
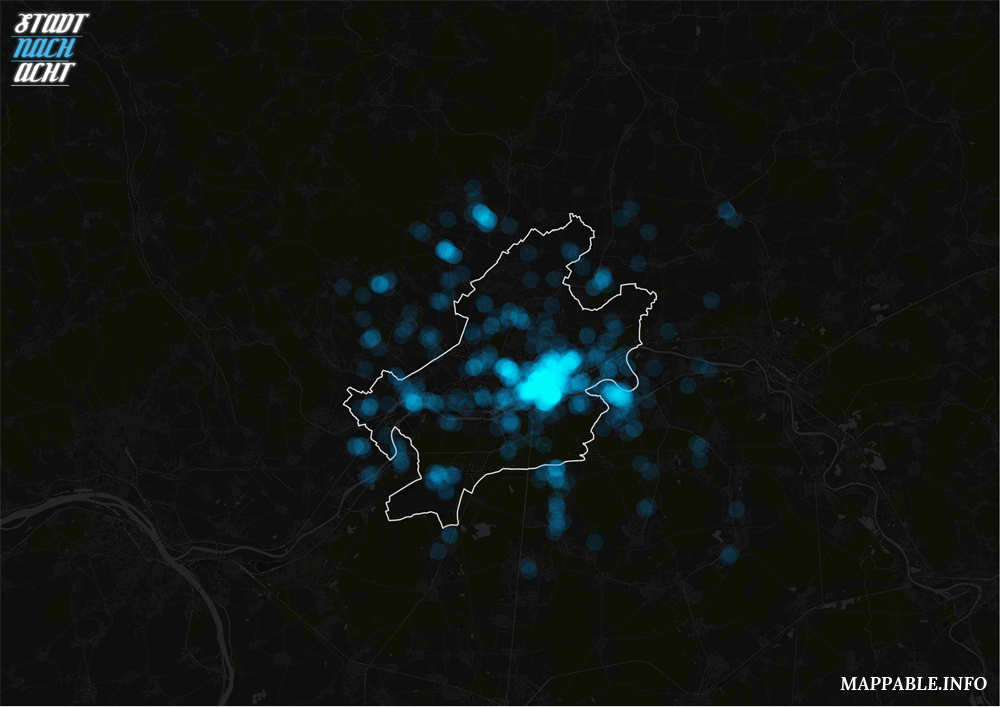
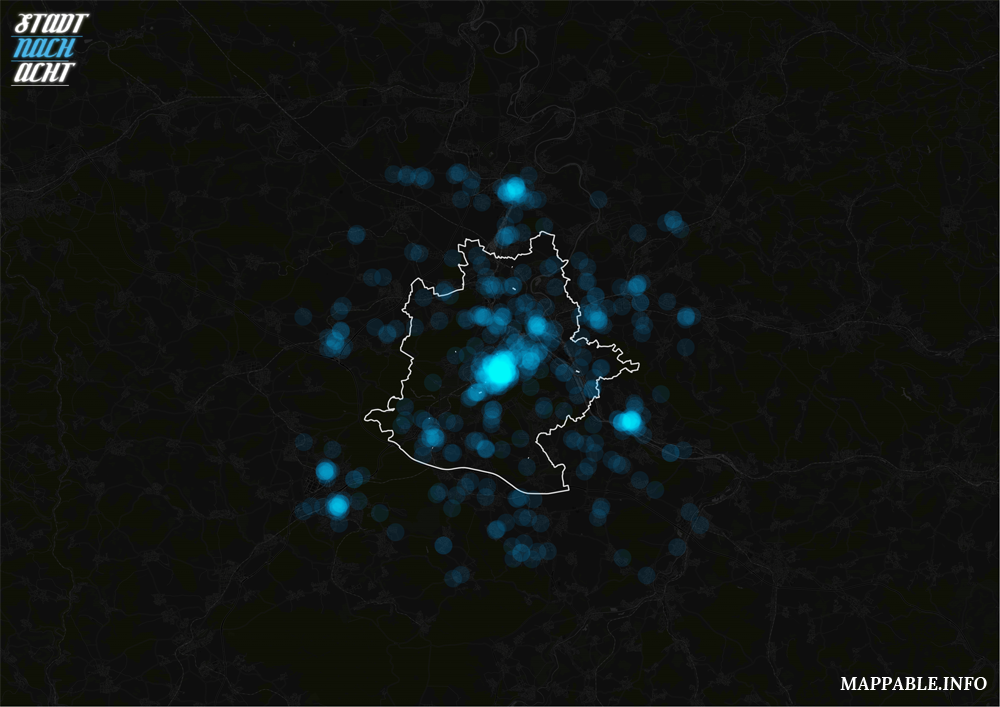
- The visualizations should allow to identify hot spots of nightlife activity in each city on different map scales.
- They should be suitable for comparing the distribution patterns between the different cities.
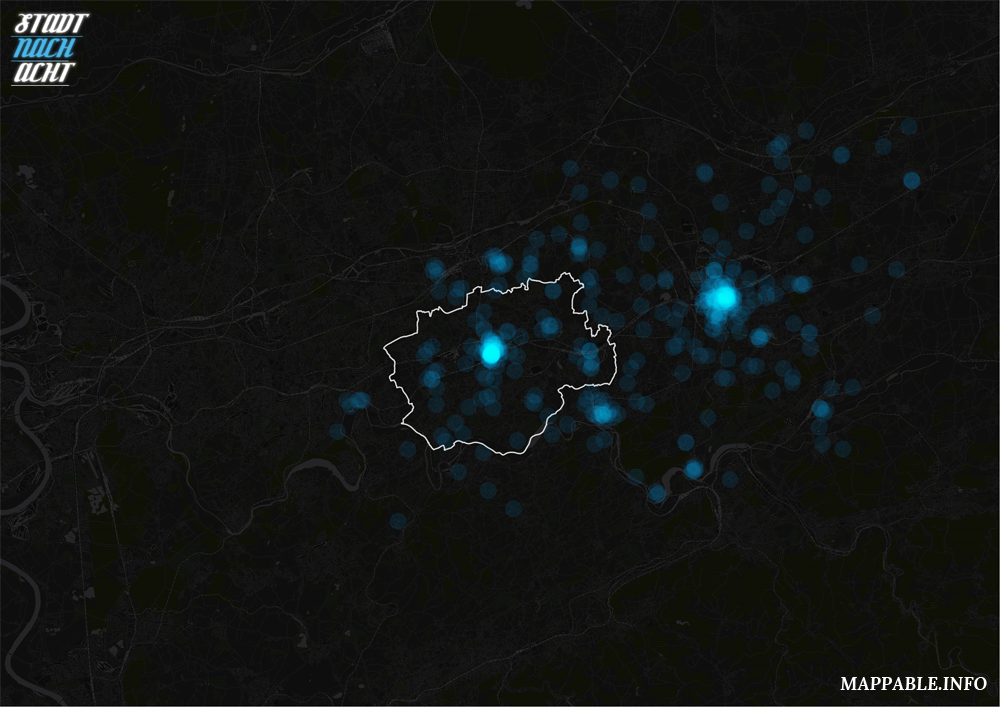
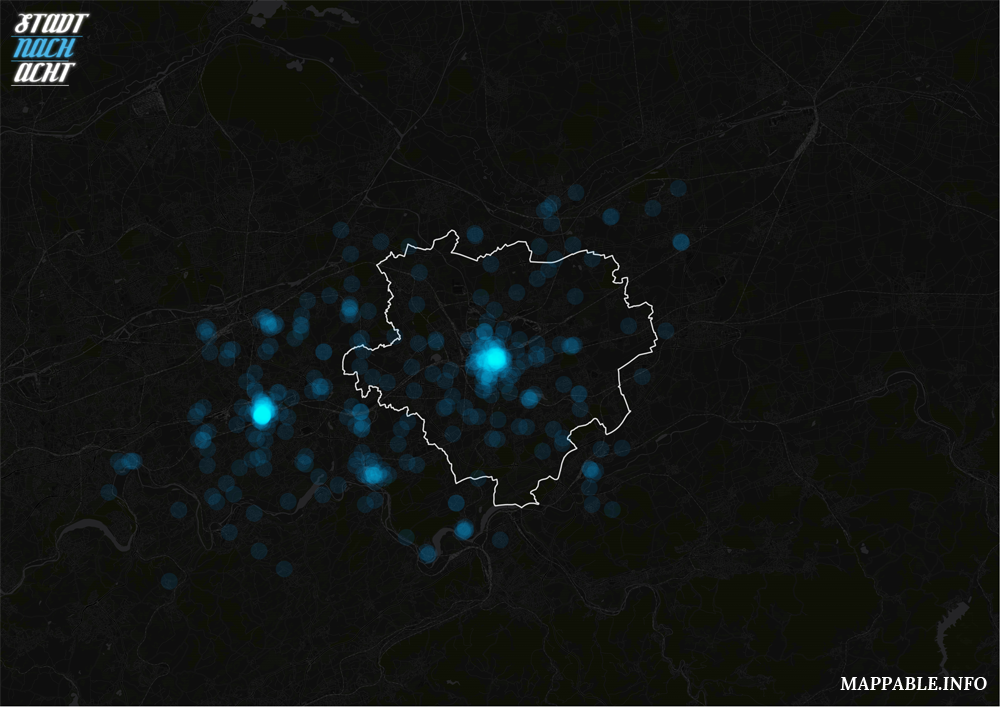
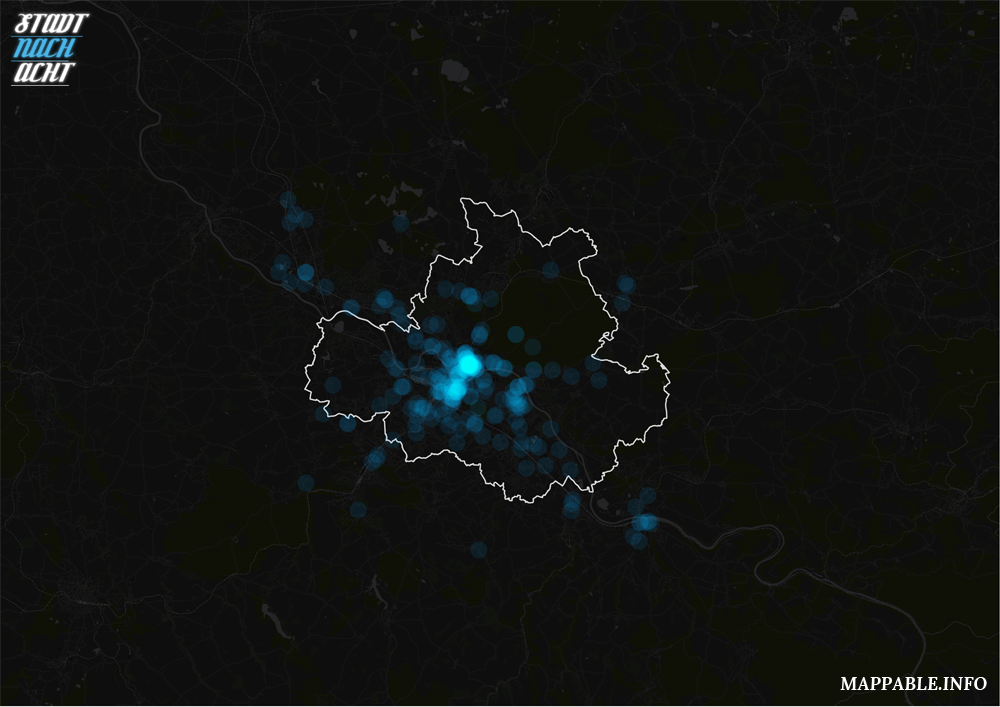
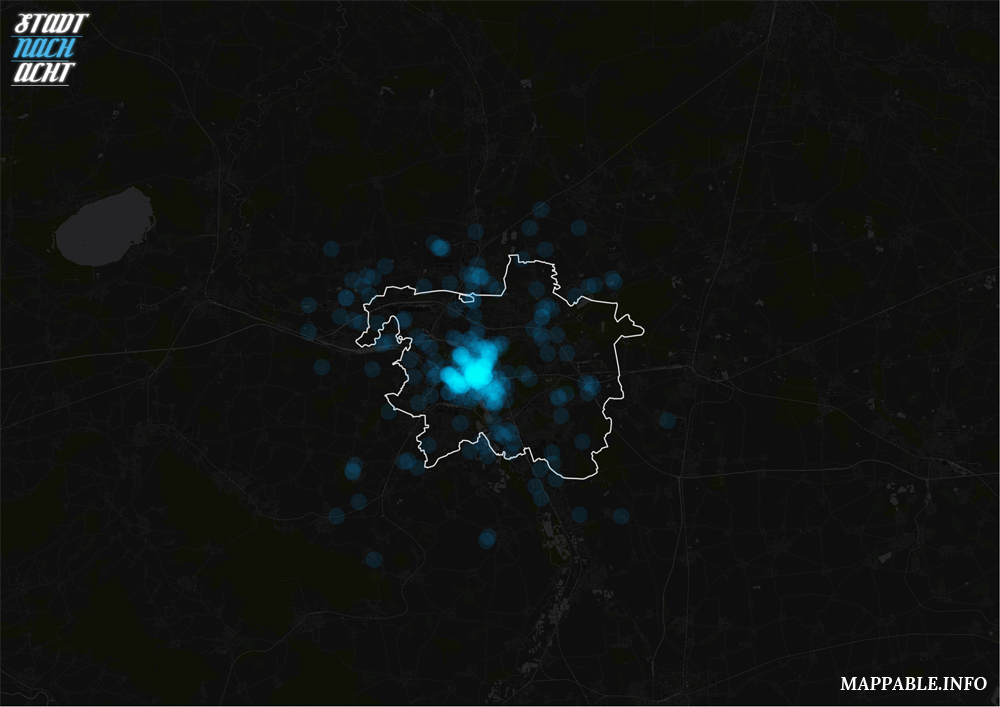
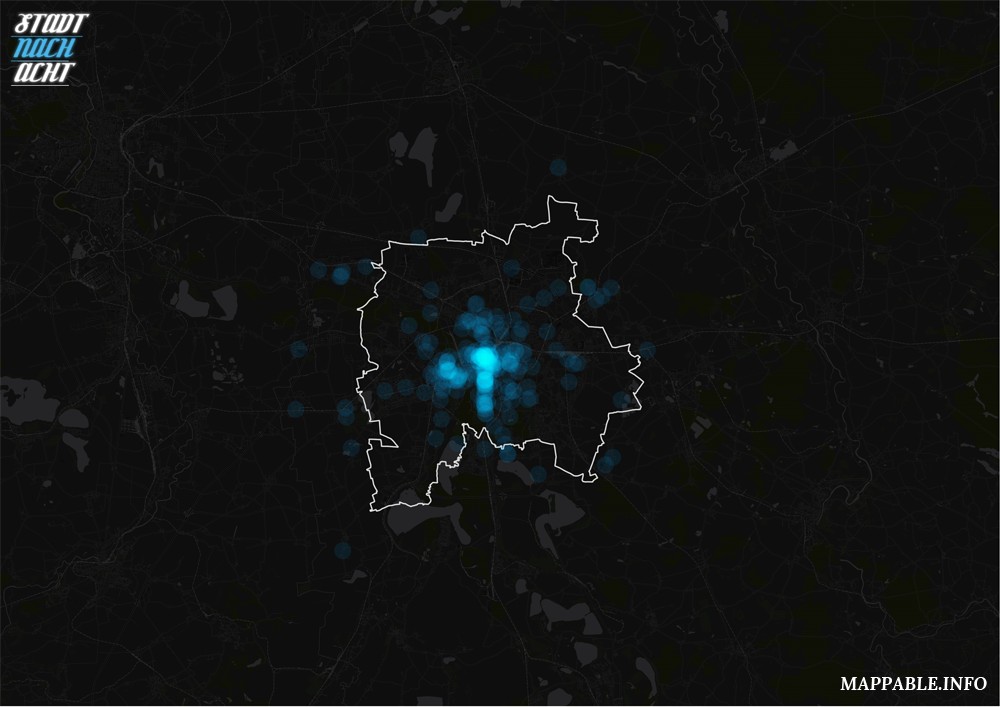
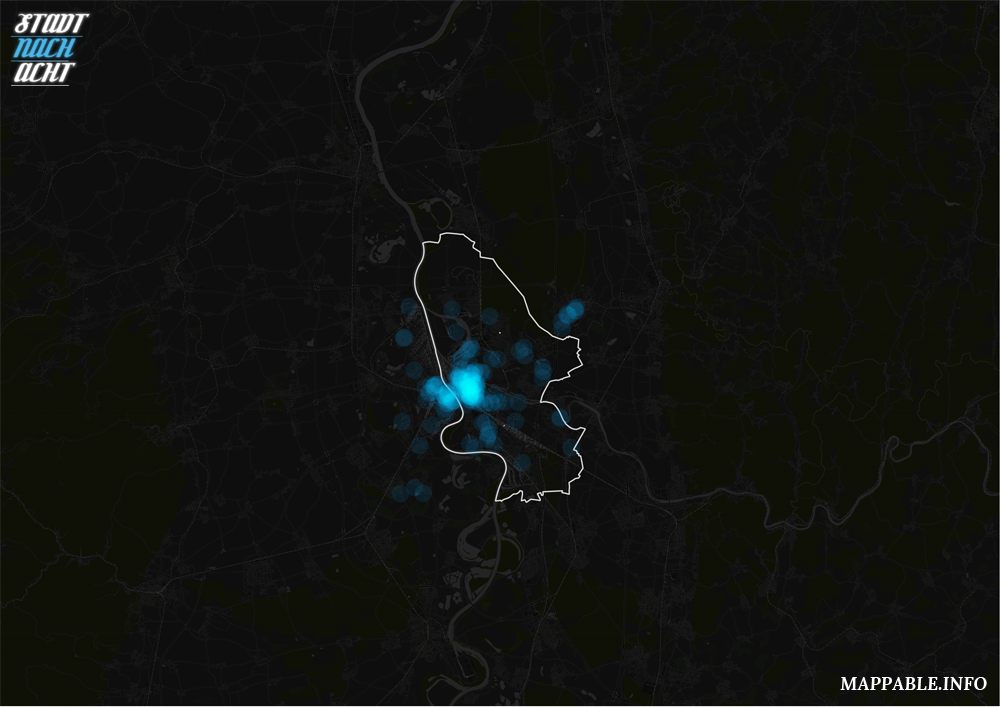
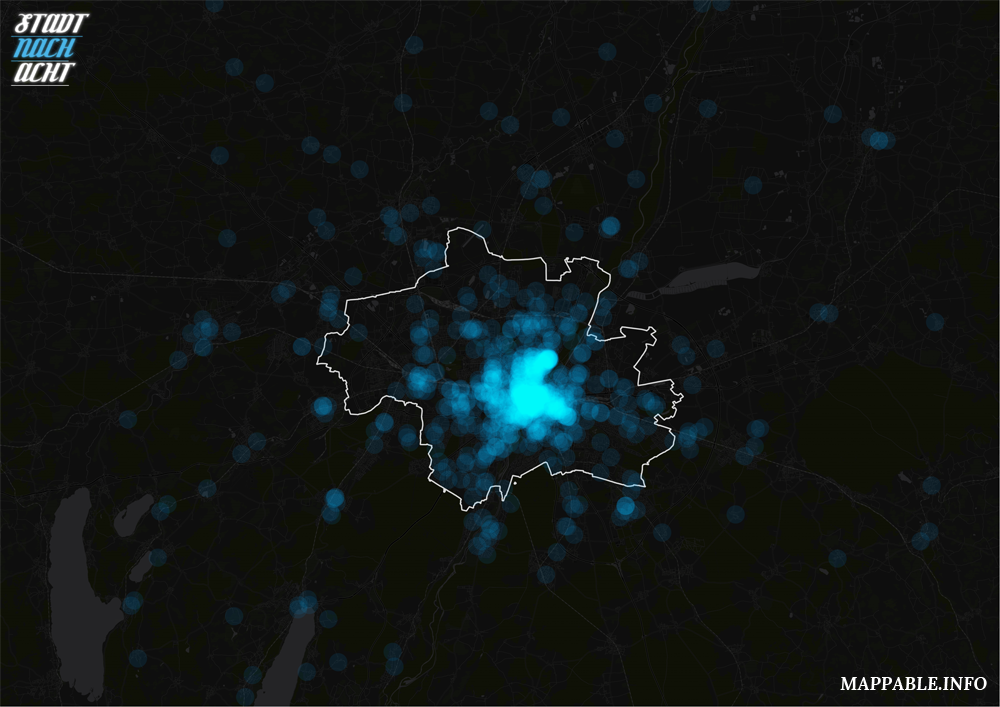
We chose to tackle this challenge with static dot density maps (sometimes also called dot distribution maps), produced in QGIS. If a data set is large enough, this approach offers a much higher precission than the ordinary choropleth map or any kind of raster or hexbin map that aggregates the data. For the map styling we used cartoDB’s new Dark Matter basemap (finally a project with a good reason to chose the ever so popular dark map style) and plotted all locations on top of it. We set the circle size to 1250 meters and used a very low opacity level as well as the feature blending mode ‘screen’ to highlight those places where a lot of nightlife locations are overlapping.
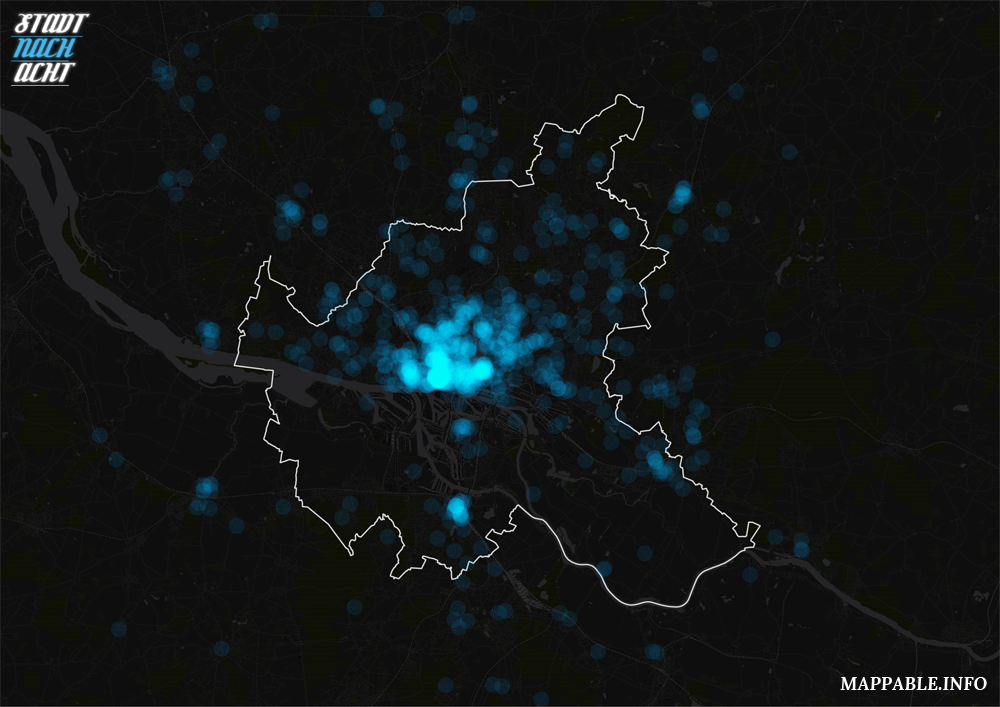
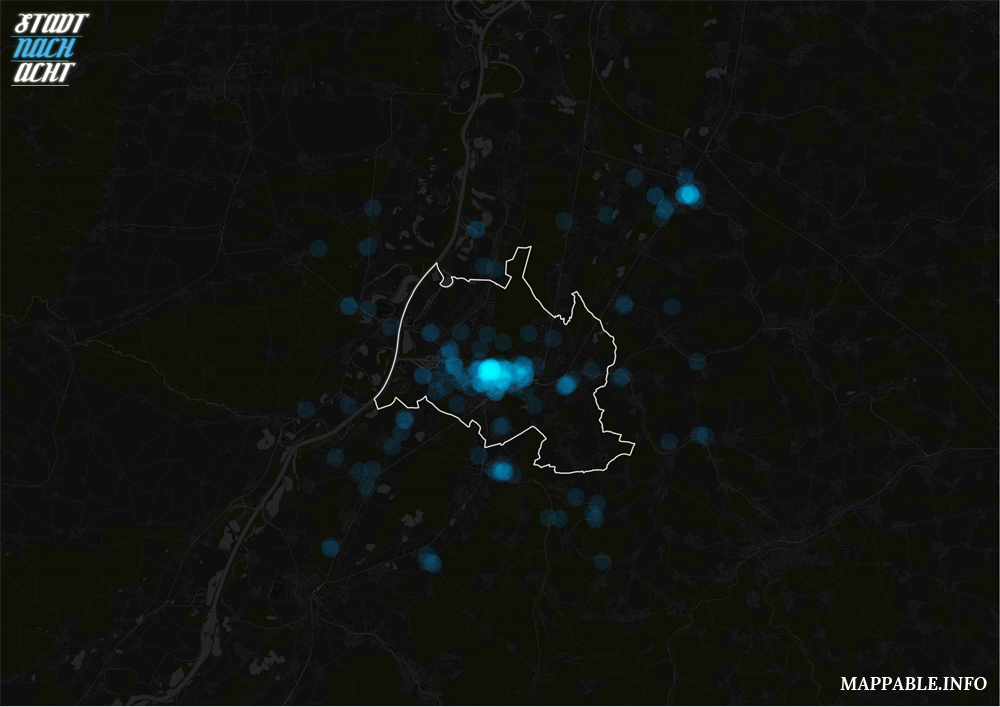
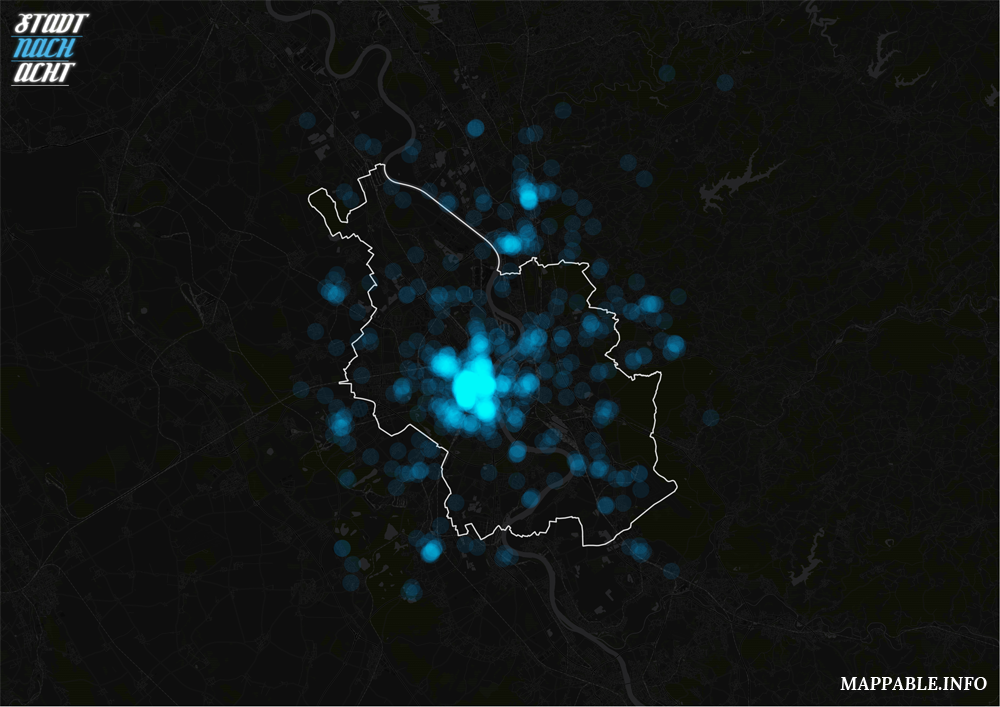
You can explore the results by either browsing through the gallery on top of this blog post or, if you want to take a closer look at Berlin, Hamburg and Munich check out the high-res, zoomable maps below. As an urban planer it’s fun to see that the nightlife patterns in most cases match to the general city structure (monocentric vs. polycentric) pretty well.
Berlin
Hamburg
Munich