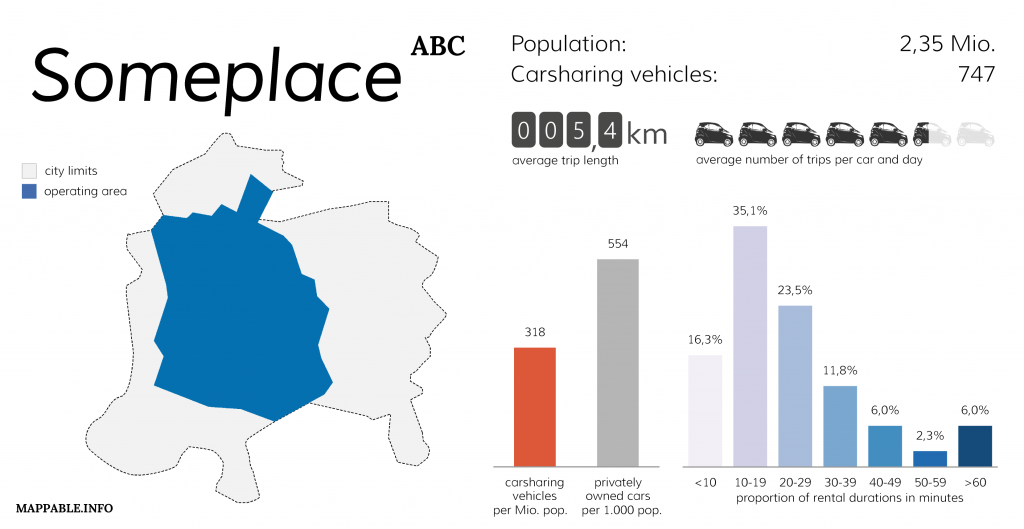
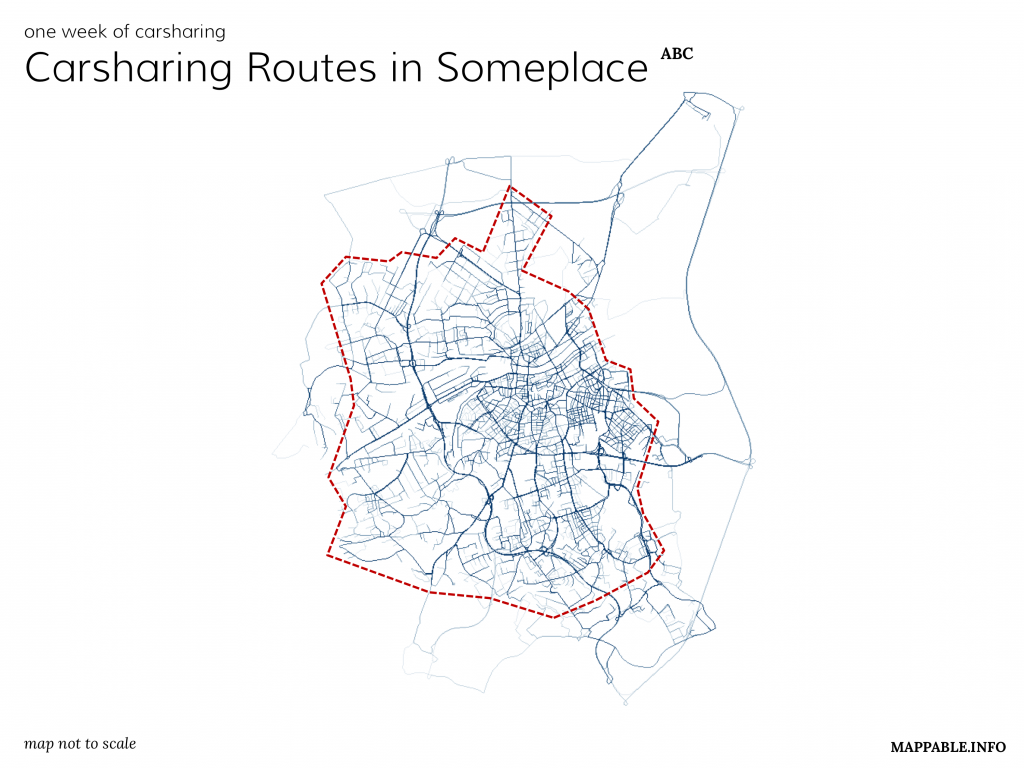
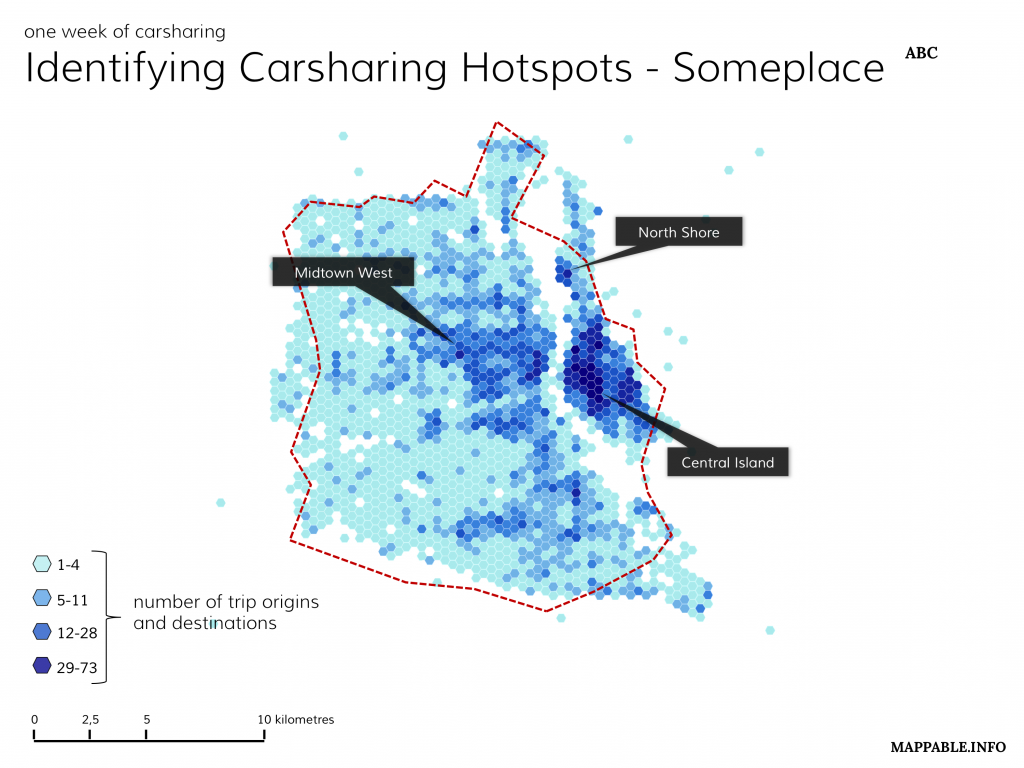
 In July 2013 we’ve released a project named ‘one week of carsharing’, for which we’ve tracked and analyzed one week of carsharing usage in 19 cities throughout Europe and North America.
Unfortunately, just one days after the initial release of our project, in which we visualized key facts like the number of vehicles, number of trips per day and vehicle, average rental duration and maps of the spatial distribution for all cities in which car2go was operating at that time, Daimler (car2go’s parent company) requested us to take the project offline. They argued that we had violated their terms of use during the process of data collection. Since then we’ve taken several attempts to contact Daimler and find a solution in accordance with them to re-publish our project. Unfortunately their reactions were very scarce and we’ve got the impression they were just waiting it out. As a consequence we thought about a way to present our project without harming Daimler’s interests: simply by showing what we did and how the results looked like, this time not with real data but with a synthetic data set for an imaginary city.
You can take a closer look at our work and the description how we realized it on our project page.
