Have you ever been in a situation where you wanted both, a highly individually styled static map and an interactive version at the same time? I recently was and I want to share my experience and my solution in this blog post.
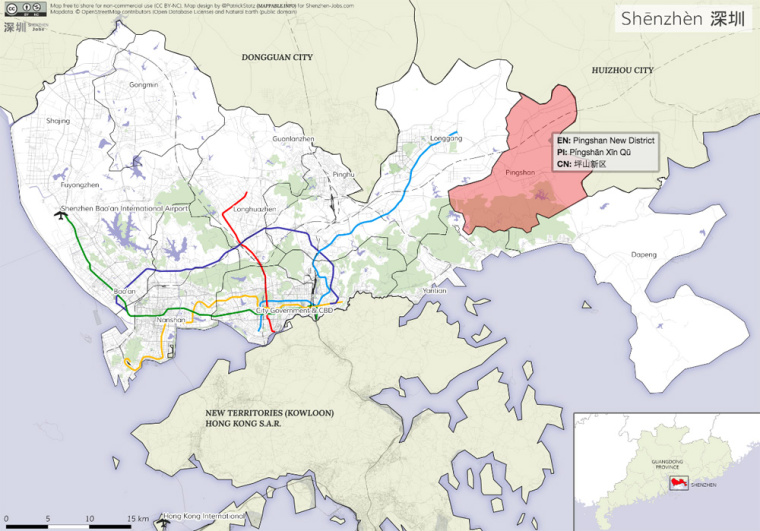
Working as a freelancer, Shenzhen-Jobs.com hired me to produce maps with an individual style, minimum external dependencies, high browser compatibility, and some interactive elements. My approach basically consists of designing individual maps from ground up in QGIS and adding simple interactive elements with Leaflet later on. You can take a look at one of my final maps below. The map’s purpose is to give job seekers, who are unfamiliar with the Shenzhen metropolitan area, a basic understanding of its geography while at the same time showing the spelling of each district in English, Pinyin tone marks and Chinese.
How the map was made:
1. Getting the data
First, I had to download the necessary data sets. Administrative boundaries, streets, train tracks and land use data were downloaded from OpenStreetMap using Geofabrik data extracts & Overpass-Turbo API. Airport locations and coastal boundaries (both mainly used in a larger scale map showing the whole Guangdong region) were downloaded from Natural Earth.
2. Map design in QGIS
All the data sets were loaded into QGIS, individual styling was applied, and labels were added. Having used Adobe Illustrator many times before to give maps a decent finishing, I was really pleased to discover that since version 2.4 QGIS even supports gradient or shapeburst fills. It allows you to create subtle shading of water bodies for example.
3. Exporting static map
The map in its final design was exported as a static file (.jpg and .png both work fine). It’s important to note down the map extents (latitude/longitude), which are displayed in the QGIS print composer.
4. Load static map into Leaflet
I won’t go through the details of making maps with Leaflet – there’s a ton of good examples and tutorials online and it’s really easy to learn by yourself. Loading the static map into Leaflet is done with just three lines of code:
The first line points to the image file, the second passes the map extends on to Leaflet and the third adds the image to the map. Pretty self-explanatory.
5. Adding interactivity with Leaflet
For adding interactivity you need to load more data into the Leaflet map. I’ve exported the district boundaries as GeoJSON with attribute fields for the spelling in the different languages.
Then, the GeoJSON file is loaded via AJAX request using the Leaflet-ajax Plugin by Calvin Metcalf. If you want to know more about how to work with GeoJSON data in Leaflet, read this blog post by Lyzi Diamond.
Once loaded into Leaflet, the Leaflet Label Plugin by Jacob Toye is used to add the labels displaying the different spellings.
To make it even more clear which district the mouse pointer is currently hovering over, I additionally used a highlighting effect, as described by Ben Welsh in this blog post.
In my eyes, this workflow is a nice solution if you need both for a project, static maps and interactivity. Moreover, I’m thrilled that everything necessary to build this map, from the underlying data to the mapping software and the web mapping framework with its plugins, is open source! Feel free to share the map (it’s under CC-BY-NC license) and here’s the source code, in case you want to build something similar: