9 days in Amsterdam – Tracking my mobility in bicycle wonderland

As you’ve probably read here before, I (Patrick) am currently on a cartography / dataviz journey around the world. I originally planed to do a lot of mapping during the trip, but didn’t have enough time to do so recently. Too many interesting places to visit and too many short stops so far (which will change soon).

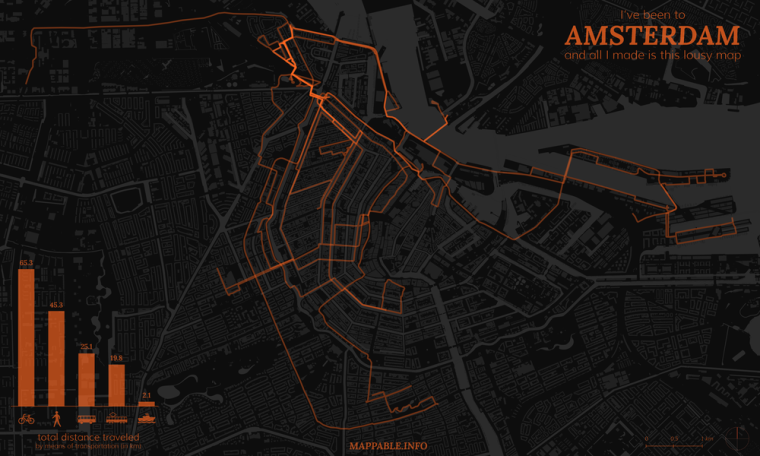
But just after spending 9 days in Amsterdam at the beginning of August, I used the bus ride to Hamburg, and a few more hours later on, for making a map of all my tracks during the stay in Amsterdam. As I didn’t have any special equipment and barely any time to get prepared, this had to work with a very simple approach. If you’re interested in a more sophisticated way of tracking your travels, take a look at Bjørn Sandvik’s blog thematicmapping.

I simply tracked my movement with a smartphone GPS and the OpenPaths service. While I had good experiences with this setup in Germany, it didn’t quite work out abroad. At that time I travelled without a data plan, which meant that my phone couldn’t make use of the A-GPS (Assisted GPS) function, which significantly improves GPS performance. What did that mean for me? Well, a lot of my position data was just useless, the GPS deviations were way too high. But I didn’t want to be stopped by that. Amsterdam and it’s channels (dutch: ‘Grachten’) just look too beautiful on a map to skip this one.

What I ended up doing, was taking the GPS positions as a starting point, made lines out of continuos points and correcting/completing them in QGIS. This took me about two hours, and while the result is not 100% precise, it’s fair enough for a few hours of work and for a first try. The next map of this kind on one of my future stops will be better and the data collection method will improve as well, I promise.

Having complete coverage of my tracks, I categorized the lines according to the means of transportation I’ve used, measured their lengths and added it up to get my personal modal split for my stay in Amsterdam. As you would expect from a city with great bicycle infrastructure, and perfect weather at that time, I ended up using the bike most of the time. For finishing my map, I left QGIS and added the chart and the title in Adobe Illustrator. You can see the final result below, or here in a high-res, zoomable view. And yes, it’s the Netherlands, so it had to be orange/oranje!

Not to forget: the individually designed basemap, with it’s buildings and channels, is based on OpenStreetMap data (© OpenStreetMap contributors), which I’ve extracted via the Overpass API and the XAPI Query Builder. OSM data is available under the Open Database License.
Biodiversity Mapping

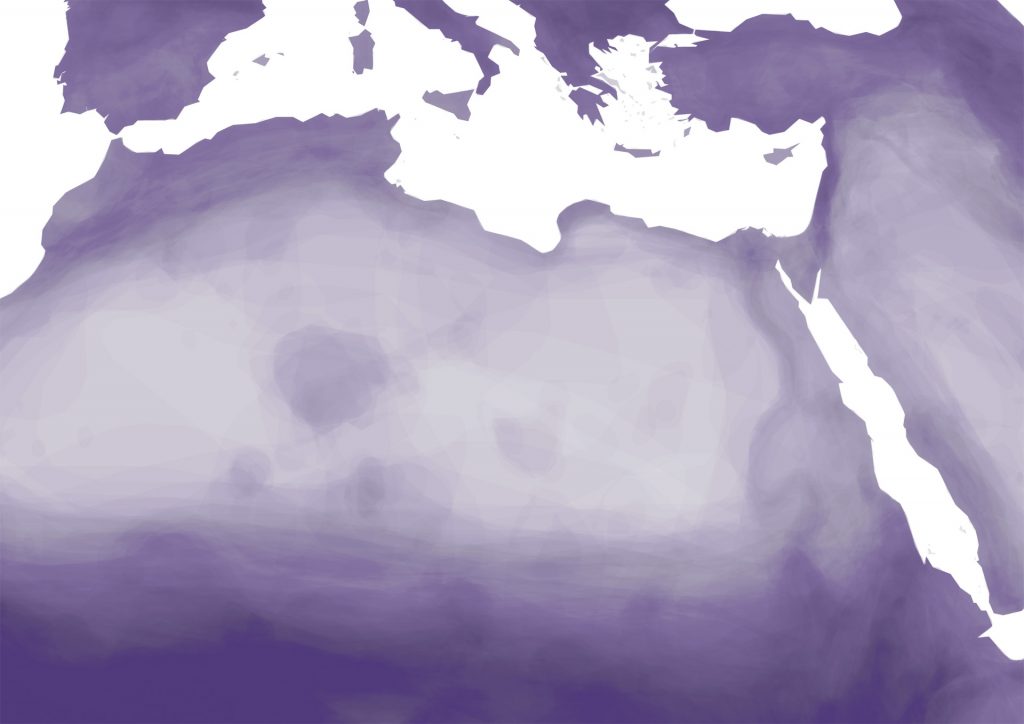
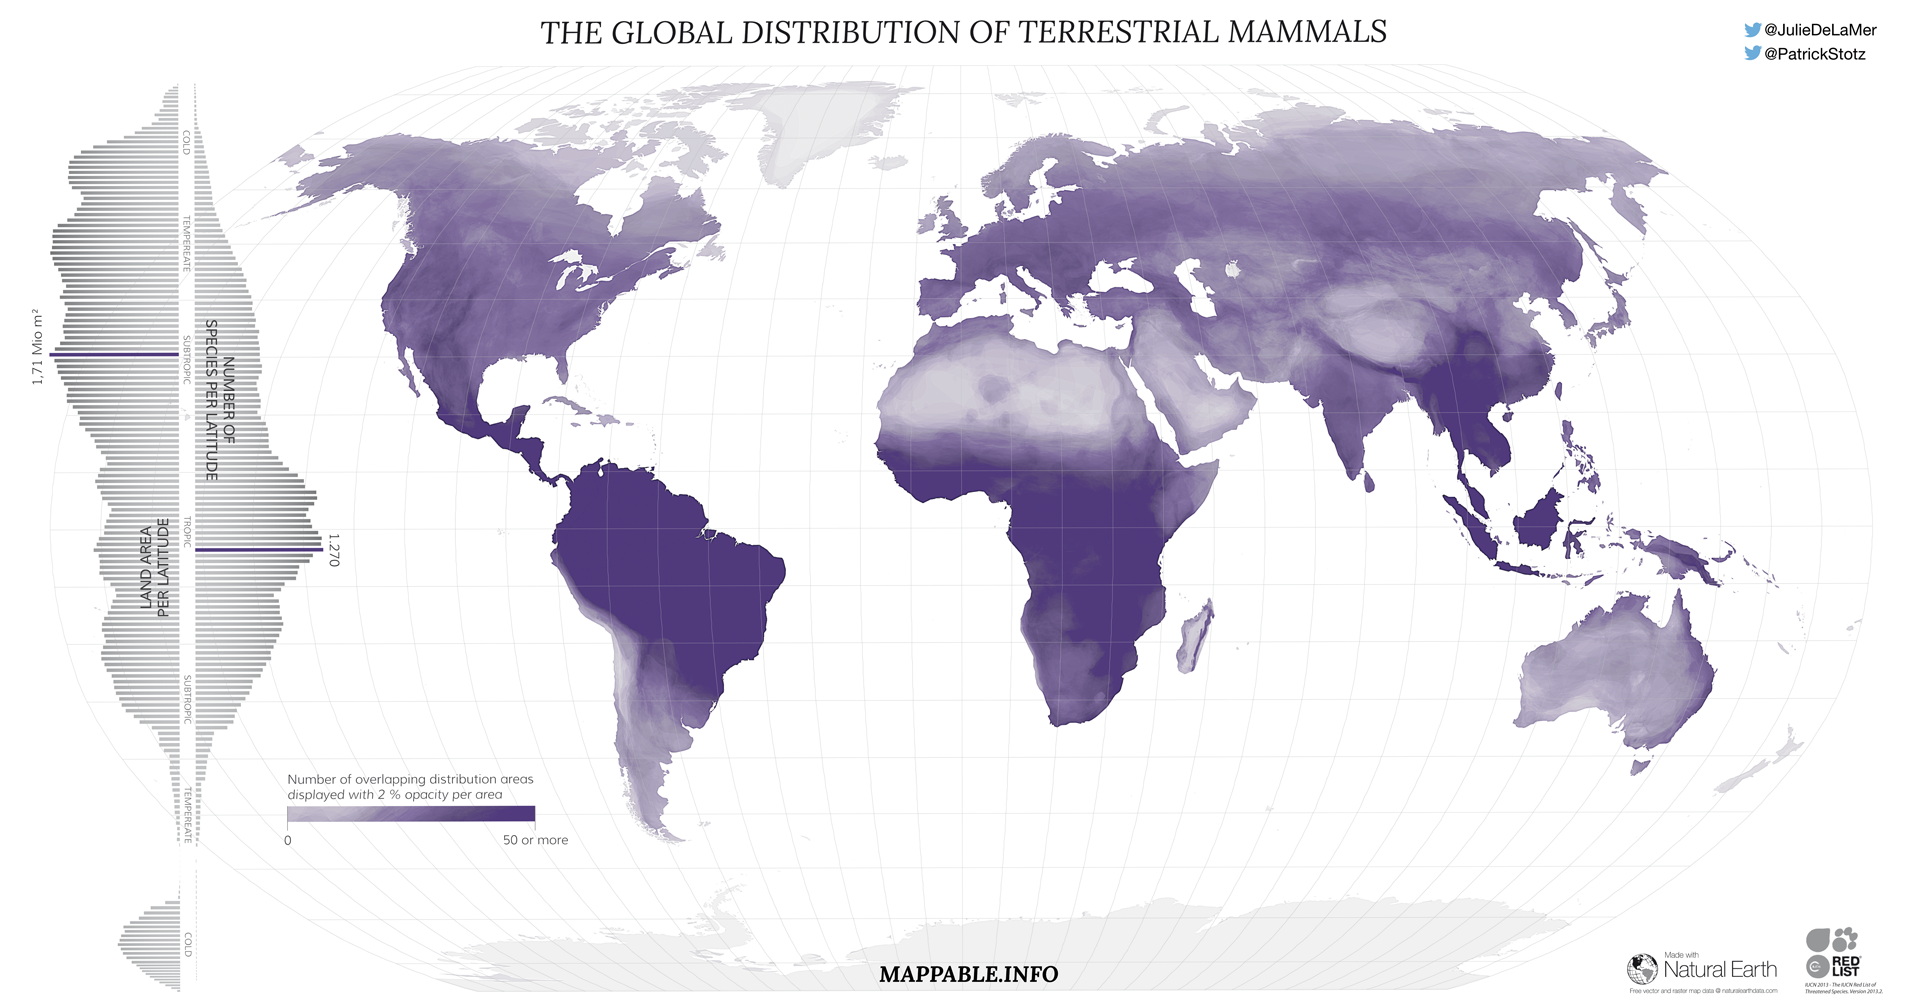
The projects we’ve published so far are all visualizations and analyses of human activity, mostly on a city scale. But there are so many more fascinating data sets out there and it’s about time for us to broaden our activities. Therefore, it was a welcome opportunity to do some mapping together with Julia Griehl (@JulieDeLaMer) who is writing her master thesis on the protection of terrestrial mammal species. As a sneak preview into her work – she’s currently adding the finishing touches to her thesis – we want to share this map on mammal distribution with you:

Click on the image for a zoomable high-res version.

Plain and simple, the map shows the distribution areas of almost all terrestrial mammals – more than 5,000 species in total. The distribution data was obtained from the IUCN Red List of Threatened Species (which in fact lists all known mammals, classified into different categories spanning from low concern to a high risk of extinction). The map we present here is part of Julia’s data source description. We’ve simply mapped all distribution areas on top of each other with a very low opacity (2%) using QGIS. Areas of full saturation consequently have a density of more than 50 species. Only hitch was the enormous data size and processing time (e.g. to exclude extinct species and delete marine distribution areas of some terrestrial mammals, such as seals, by clipping along coastlines using Natural Earth data).

Even tough the map is rather simple and descriptive we still like it for it’s unique style. It rather has the appearance of a precipitation map than a biodiversity map.

As a little extra, we’ve calculated statistics per latitude and visualized them as bar charts with Adobe Illustrator’s graph functionality. The bars visualize the size of land area (left axis) and the number of species (right axis). It’s quite easy to spot that the highest diversity of terrestrial mammals can be found in the equatorial belt – areas with tropical climate – whereas the peak values for landmass are between 25° – 50° N.

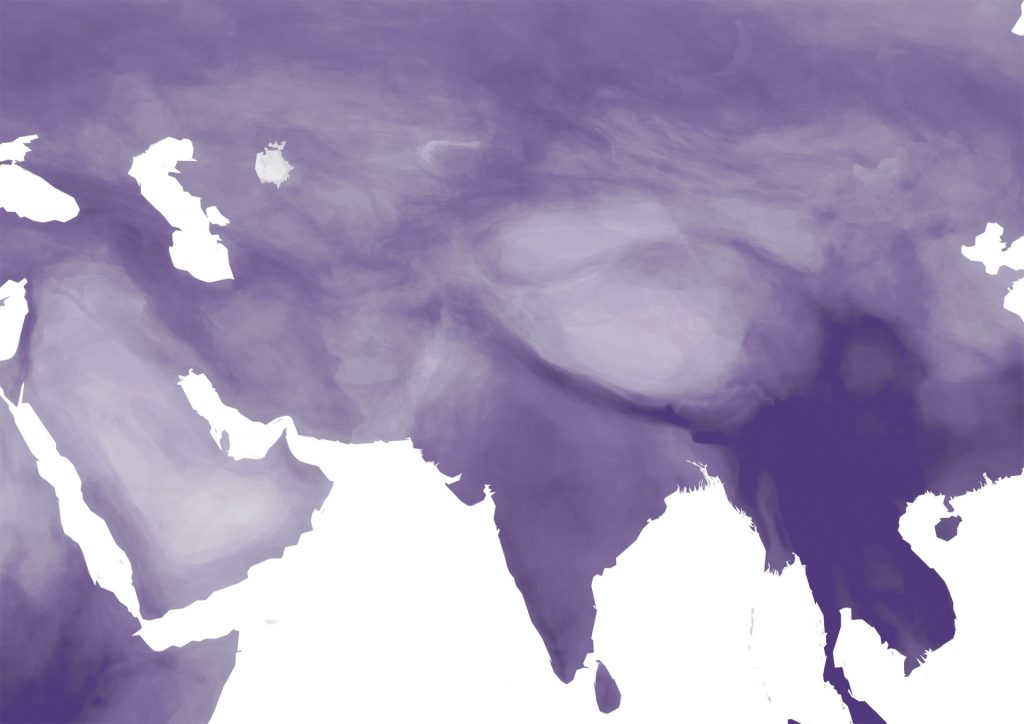
But enough text and time for some visuals. You can explore the map in a full-sized zoomable view when you click the world map image above. It’s fun to zoom in and see how diversity is changing rapidly – for example between the the Gangetic Plain, Nepal and the Himalayas. Or how the mountain range of ‘Tassili n’Ajjer’ stands out in the middle of the Sahara Dessert.

The limited accessibility of public transport

Taking the tube or suburban railway for your daily commute is quite comfortable if you live in a city with a well developed public transport network. But as so often in life we quickly take things for granted and tend to forget that such amenities are not accessible for everyone. And I’m not referring to people living in cities without efficient public transport, but those who are, due to limited mobility, not able to use parts of the public infrastructure. Even though there certainly have been a lot of improvements in the accessibility of public transport stations during the last decade or two, there are still far too many stations in almost any bigger city which are not accessible for someone who is e.g. in a wheelchair. And even if there are big efforts to improve the situation, very old stations in densely populated areas just make the construction works very complicated and costly.

We are all disabled – sometime or another

Fortunately there are projects like Raul Krauthausen’s phenomenal wheelmap, which collects accessibility details for all kinds of points of interests by crowdsourcing and maps them on top of an OpenStreetMap base layer. He states that everyone is certain to be in need for a barrier-free environment sometime or another: Whether you are sitting in a stroller as a baby, using a wheelchair or crutches when injured, or a walker as an elderly. 

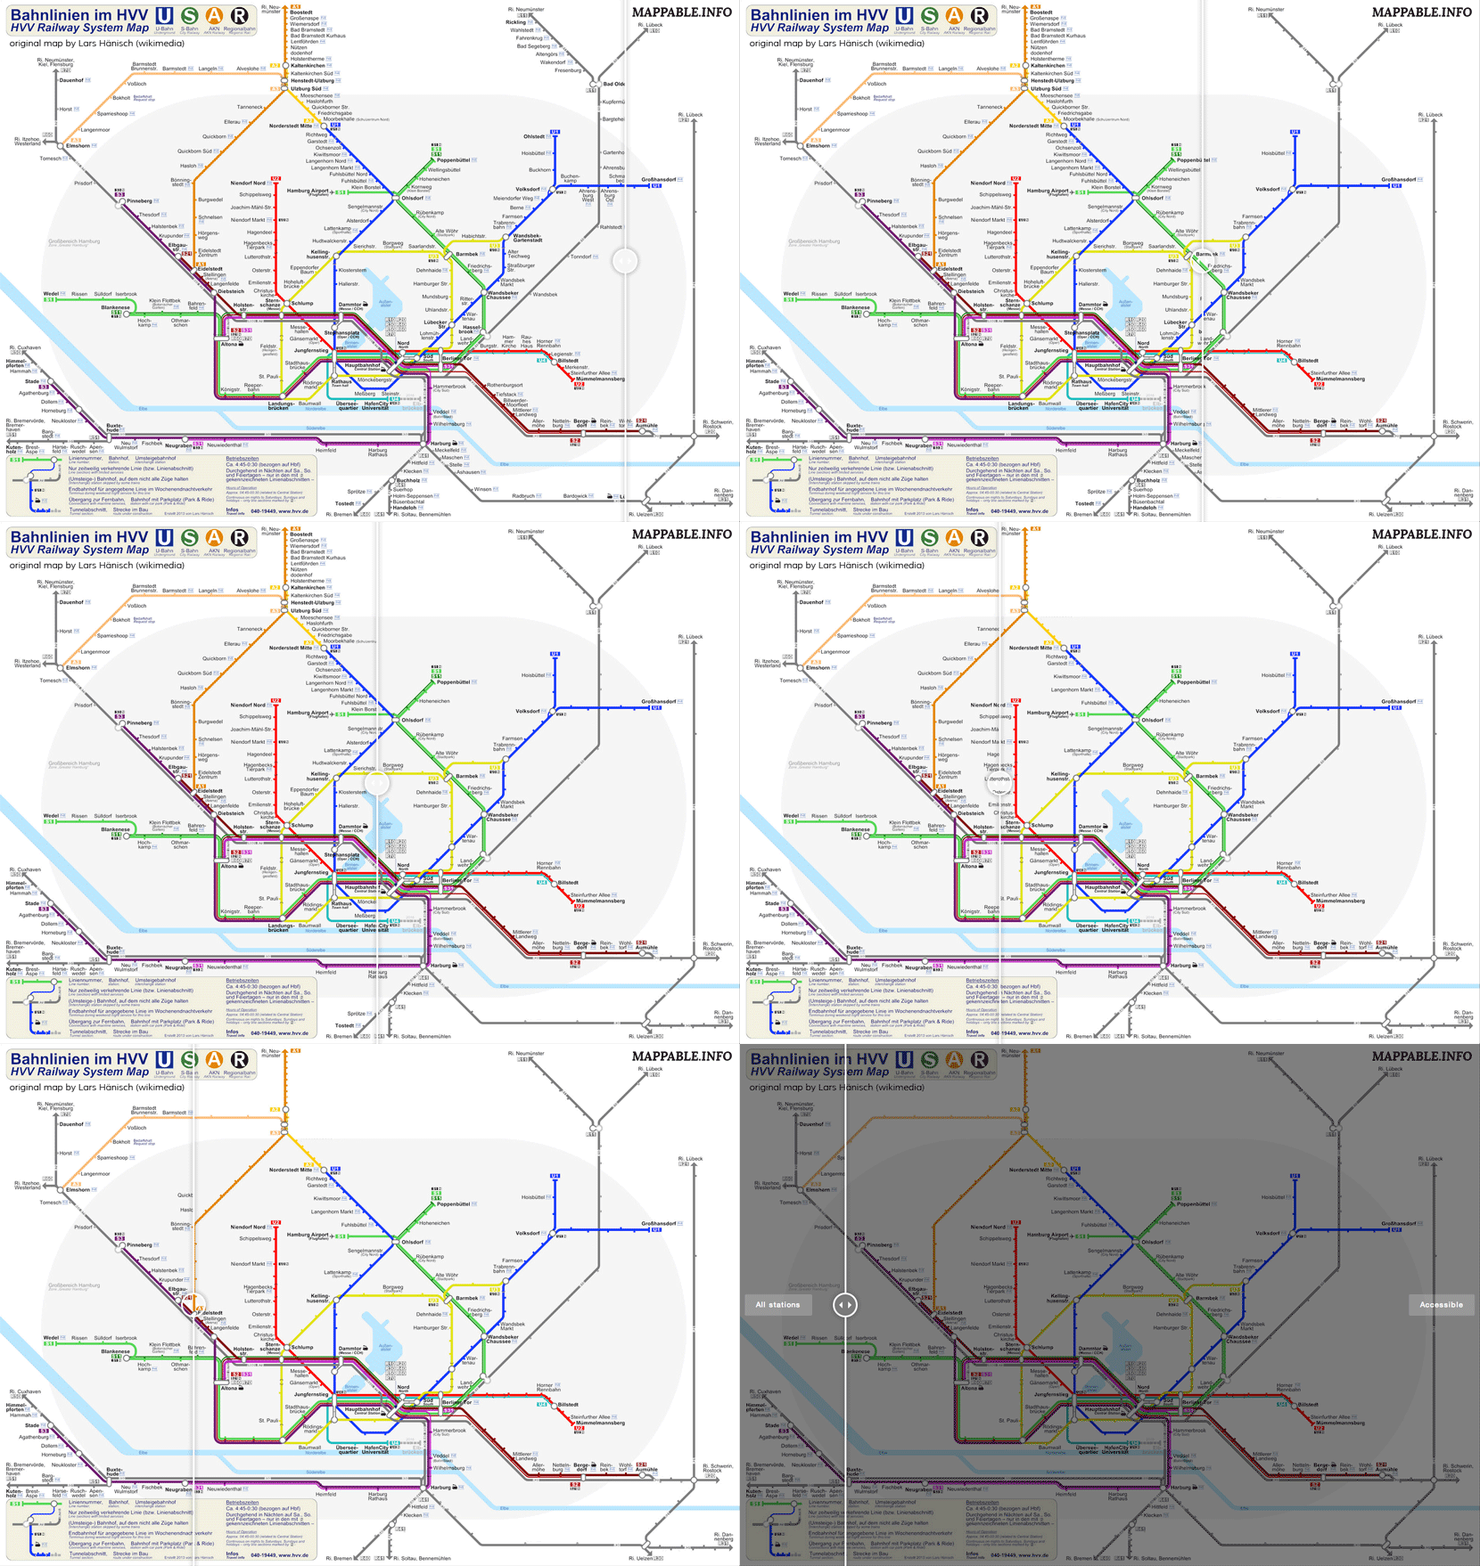
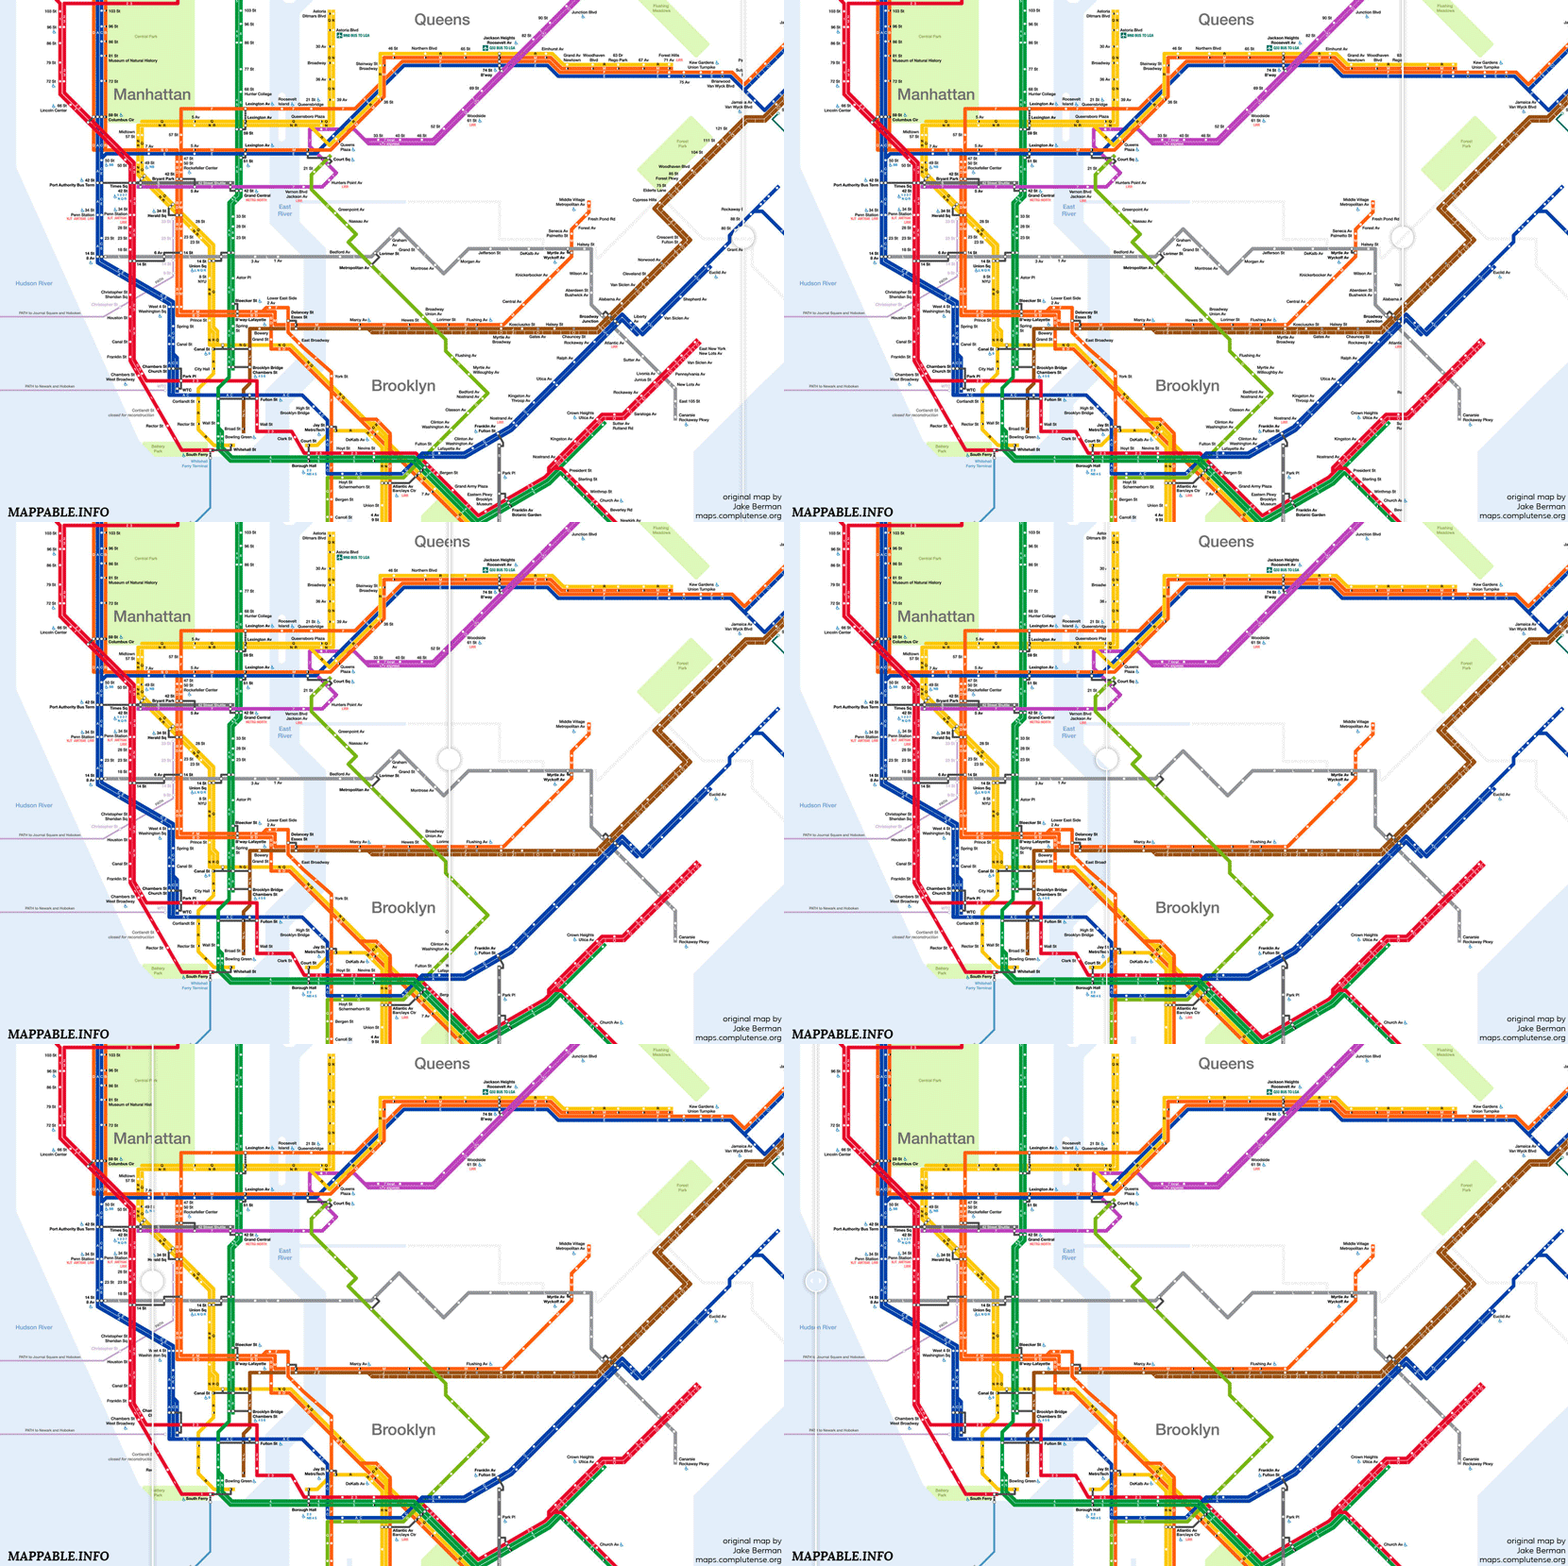
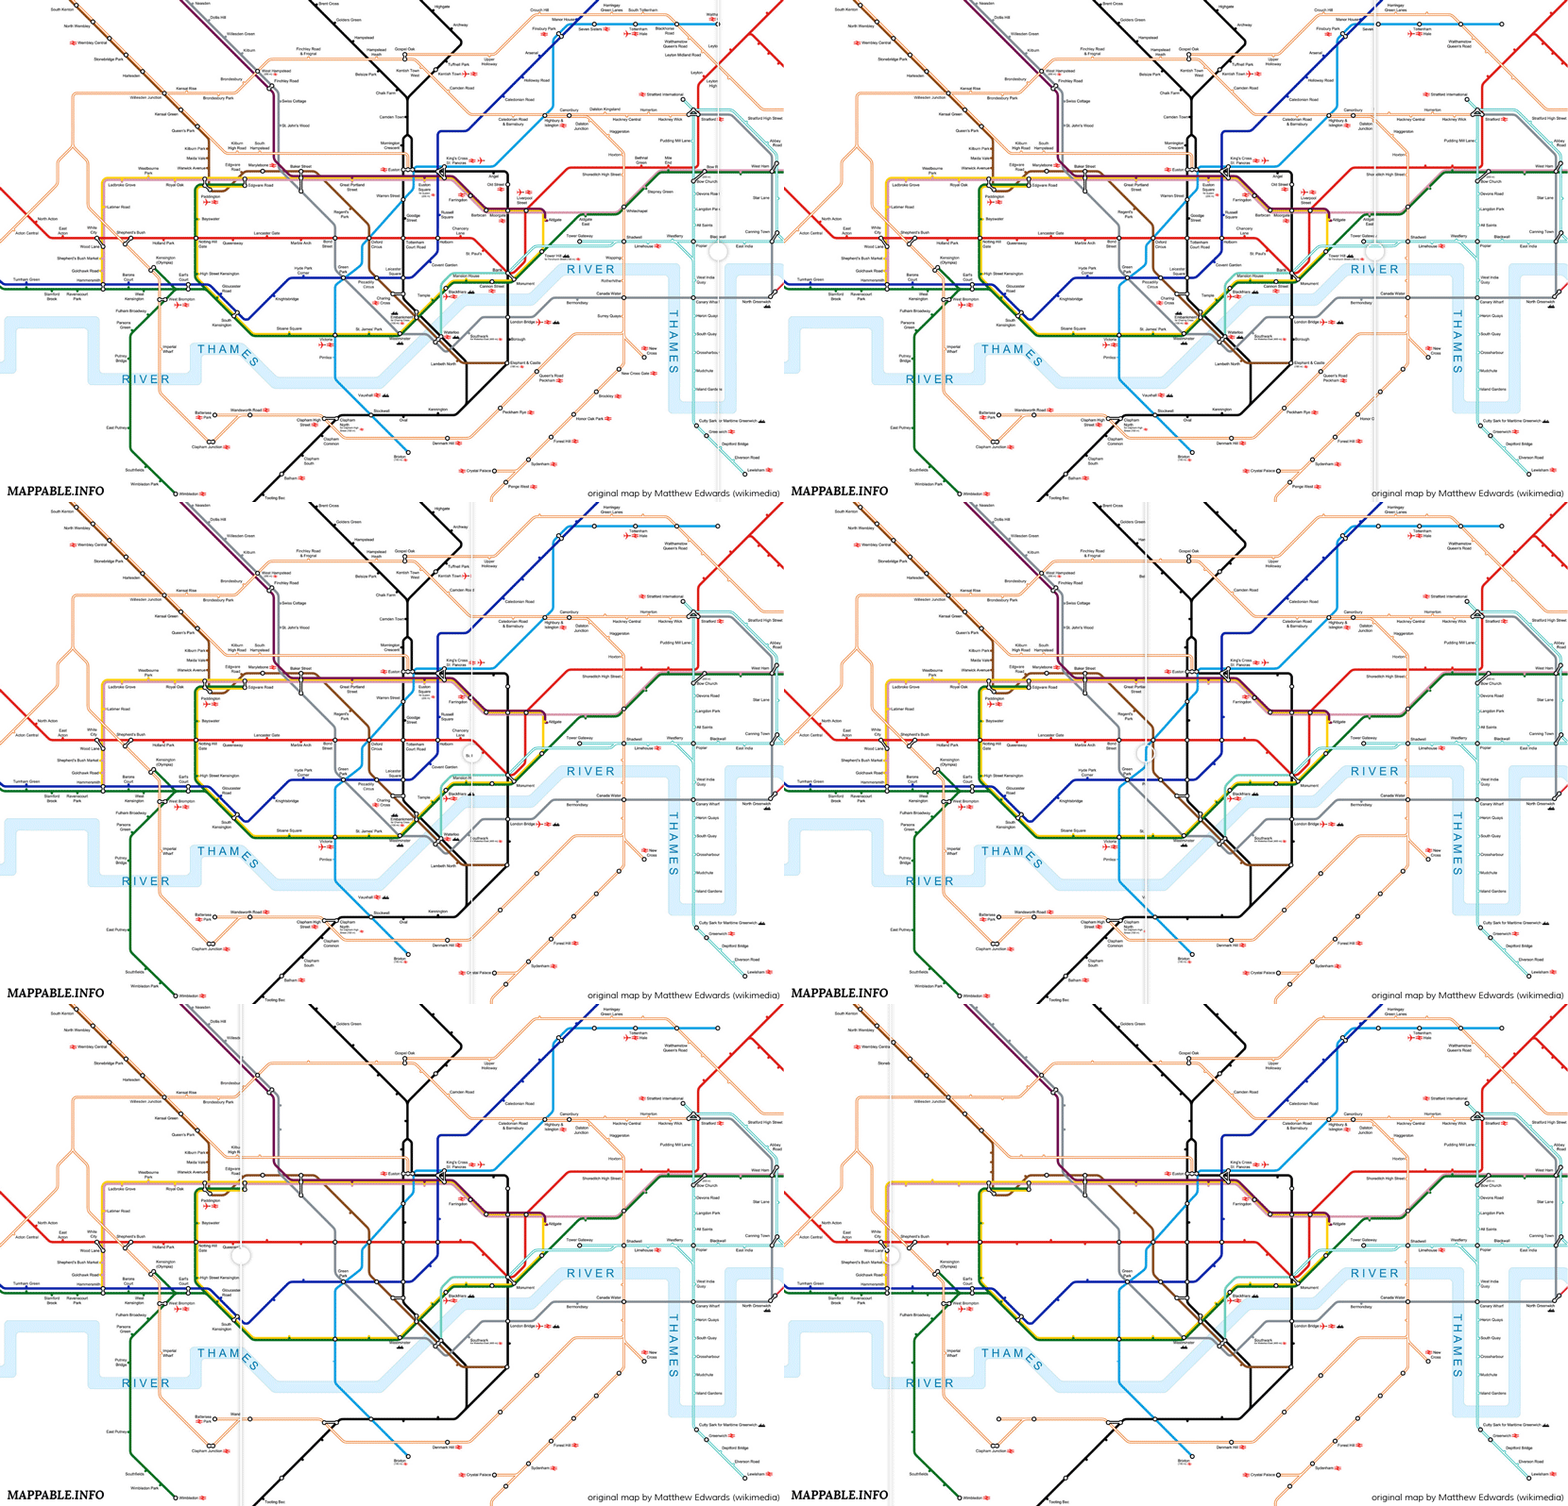
While this and other tools help to improve the situation of handicapped people, we nevertheless think that from time to time it’s useful and necessary to remind ‘the public’ about the limitations of ‘public transport’. In order to do so we chose a quite simple approach and remapped the public transport network in Hamburg, London and New York together with Julia Griehl (@JulieDeLaMer). 

How did we do this? Well most public transport networks publish maps which quite clearly symbolize the accessibility of every station. Our approach was to take open licensed versions of these maps and remove the name of every station which is not marked as wheelchair accessible (we used information from the official maps to identify them – knowing that each city might have a different definition of accessibility). The results are maps which show how thinned out those networks suddenly look from the perspective of a handicapped person. Just click on one of the animated images to get to a larger view with an interactive slider to swipe between the two maps.

Create a map for your city!

For those of you who are interested in the techniques involved in creating these maps or want to draw your own map for the city you live in, here’s how it’s done:

First you need a map of the chosen transit network with a license that let’s you modify it and publish your work. Finding such a map might already be the hardest step, as the official maps mostly are released under quite restrictive copyright (looking at you, London!). You therefore need to be lucky to find an alternative version released by someone who put quite some effort in drawing his/her own version. Probably the best place to search for such maps is wikimedia commons. In our case we used the maps of Lars Hänisch, Jake Berman and Matthew Edwards. Thanks a lot for making those maps and releasing them under open licences!

Next, we suggest to look at an official map in order to identify stations indicated as accessible. You can use the drawing software of your choice to remove the names of those stations that are not accessible. We used Adobe Photoshop and Illustrator (for bitmap- or vector-images respectively) but any other drawing tool will be just fine too. Additionally, we altered some map details (e.g. removed unnecessary labels, changed some colors and stroke-widths) to improve the readability, but that’s an optional step. 

To get this fancy visual diff view there’s the jquery-plugin TwentyTwenty. Just as the maps, this little piece of software is released under an open license and requires only a few very simple steps to setting everything up. It won’t be a challenge for you, even if you’re not familiar with coding and there are step-by-step instructions to be found here.

Finally, if you want to publish your results to the web, you need some webspace. There are tons of possibilities to do this. If you are not familiar with this kind of stuff, check out the options dropbox has to host your own website. It might not be very professional – but hey, it’s for free and it works reliably. We use it too, if we want to publish content which conflicts with the content-management-system of Squarespace (our hoster). (We’ve switched to github pages in the meantime)

Join the Open Data Day 2014

If you like these maps and want to produce some of them on your own, or you have other ideas what could be done with open data, why not join in on the Open Data Day at February, 22nd? There are going to be meet-ups with friendly people who do awesome stuff with public data in many different cities all around the world. If you want to join us in Hamburg, you’re welcome and can find all the necessary information here