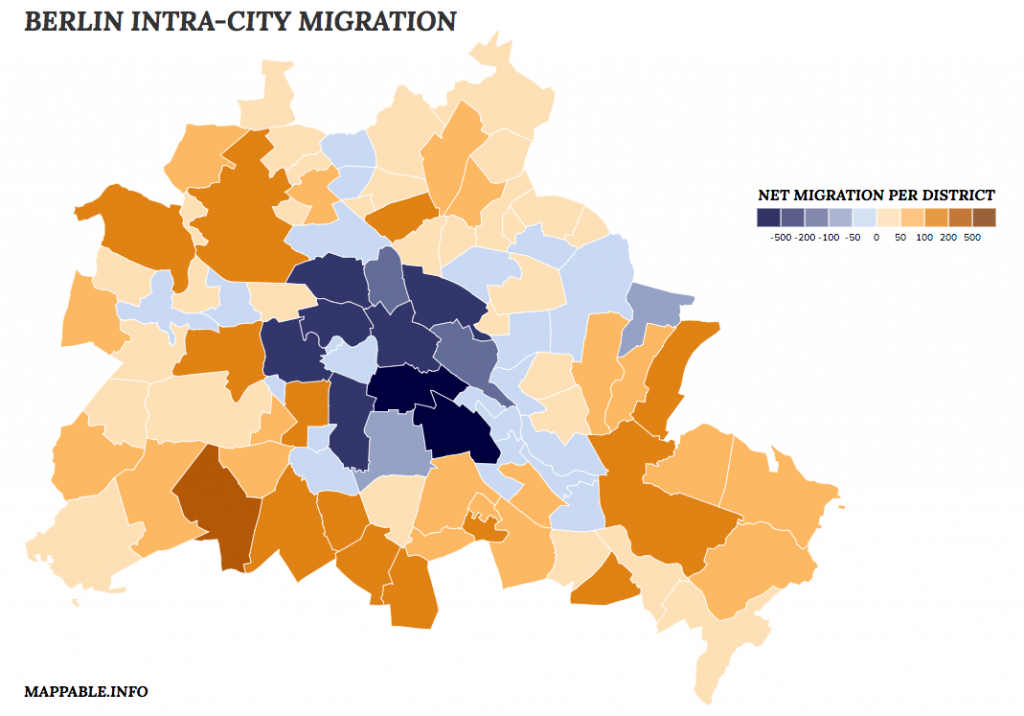
D3 (Data-Driven Documents) is not only one of the currently leading dataviz tool, it also has huge capabilities when it comes to mapping. Here at mappable we’ve so used it for building Travel Score and the Berlin A-Z maps. D3 has a quite steep learning curve, but since I’ve successfully worked with it while only having very basic JavaScript knowledge at that time, it’s definitely doable and in my eyes well worth the effort.
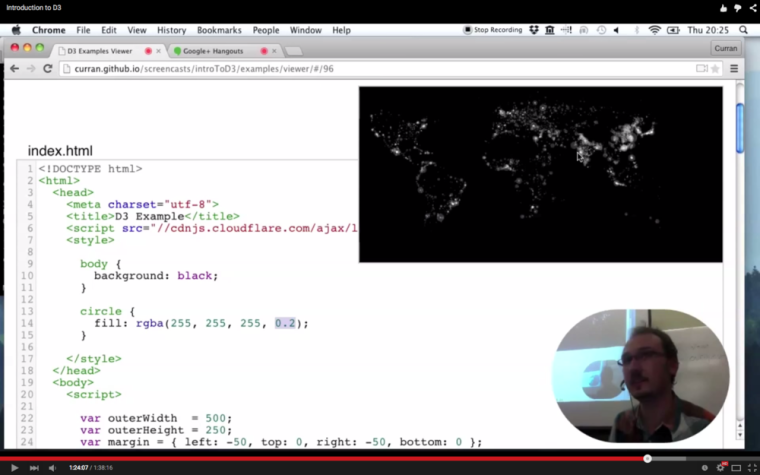
Not having used D3 in quite a while and a little worried that my skills would turn rusty soon, I was pleased to find this tutorial by Curran Kelleher in my twitter feed the other day. It’s a great introduction into D3 and was a welcome opportunity for me to kick start working with D3 again. Close to the end of his tutorial (here), Curran shows how to draw a world map in D3 simply by plotting graduated circle markers according to their lat/long coordinates using Geonames data. I instantly liked the idea and though it would be a good exercise to give the visualization a few additional touches, making use of D3’s extensive mapping functionalities.
First of all, I decided to use D3’s build in orthographic projection. With just a few twists and configurations I had a beautiful globe instead of a flat map. Next, I wanted to get that globe spinning. Why? Basically, because spinning globes are totally fascinating and look awesome! Again, this can be done by adding just a few lines of code. There’s a great example by Mike Bostock showing the basic principle, which I adopted. Finally, to add some simple interactivity, I’ve integrated some HTML5 sliders and a color picker with the corresponding event listeners.
All together this gives us a spinning globe, showing all cities in the GeoNames databast with a population of more than 100.000 and handlers to manipulate rotation speed & direction, marker opacity, size & color. The result might challenge the rendering capabilities / the processing power of your computer, since it constantly re-calculates and re-projects the positions of over 4.000 markers on the globe. Looking at my machine (a 2013 MacBook Air) that amount is probably at the limit of what you should do with SVG transformations. If you want to build something bigger, working with either canvas or WebGL might be a good idea (see this OpenViz conference talk by Dominikus Bauer for a proper explanation).
Anyway, I’m quite happy with what I’ve build and wanted to share it, since I’ve learned so much just by looking at all the awesome examples out there.
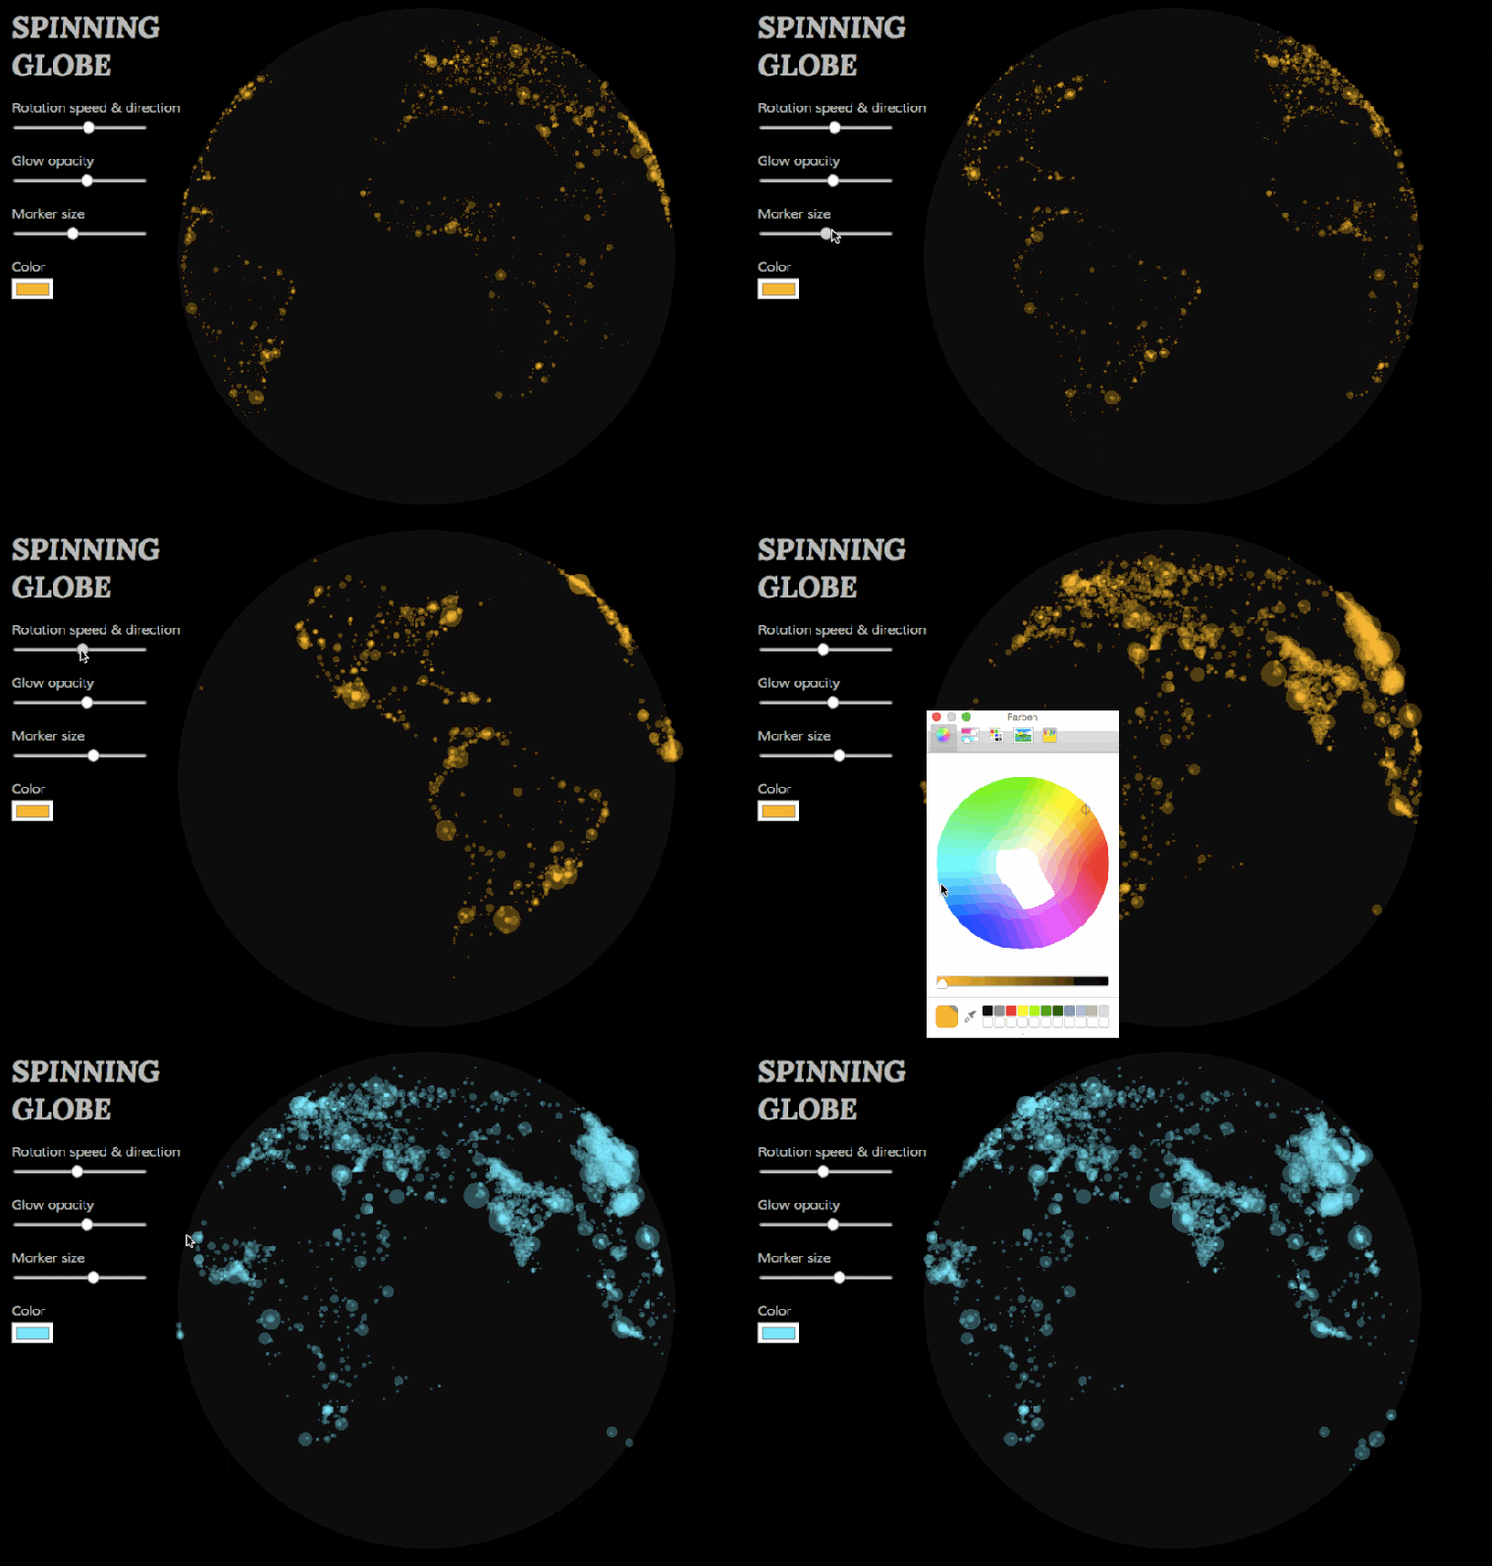 The globe visualization and the source code can be found here or by clicking the image. I decided not to embed it into the blog post, but to use a animated GIF instead, since it could lag or crash browsers on weaker machines. Please also note that the visualization is only optimized for Chrome browsers. I didn’t invest any time in cross-browser compatibility.
Have fun playing with it and happy mapping with D3!
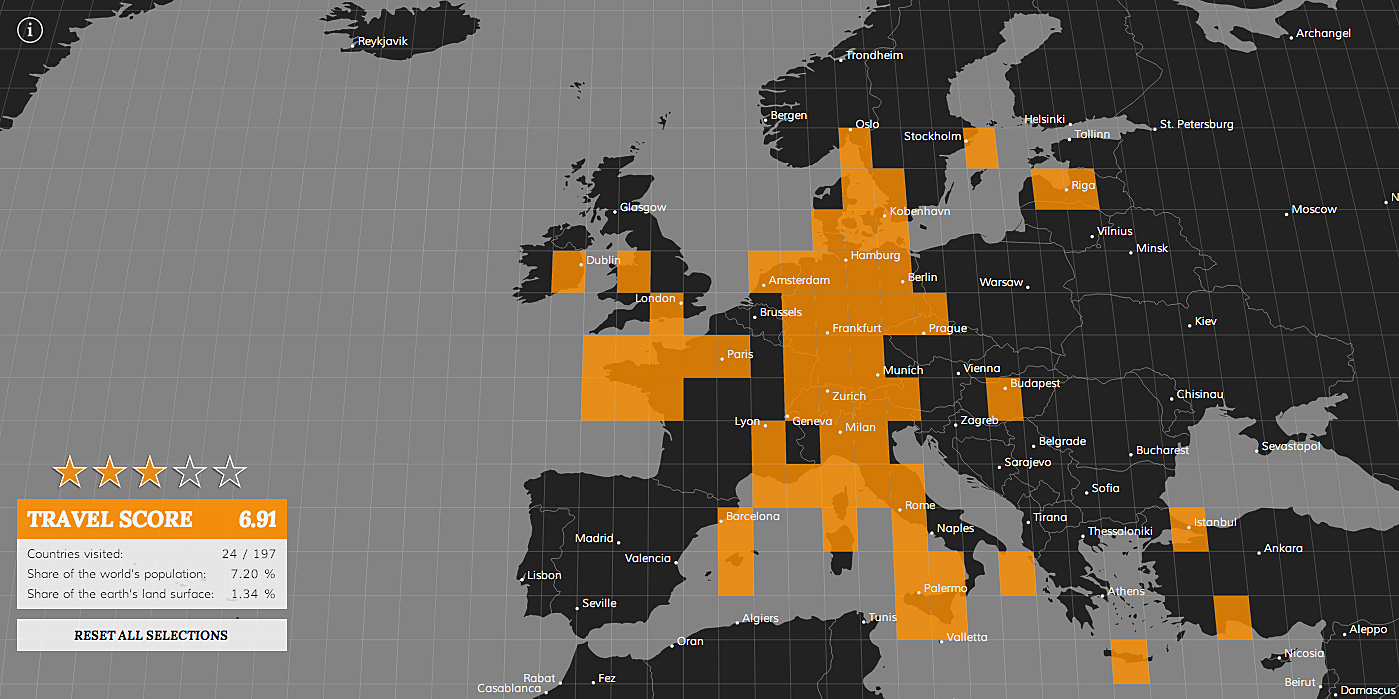
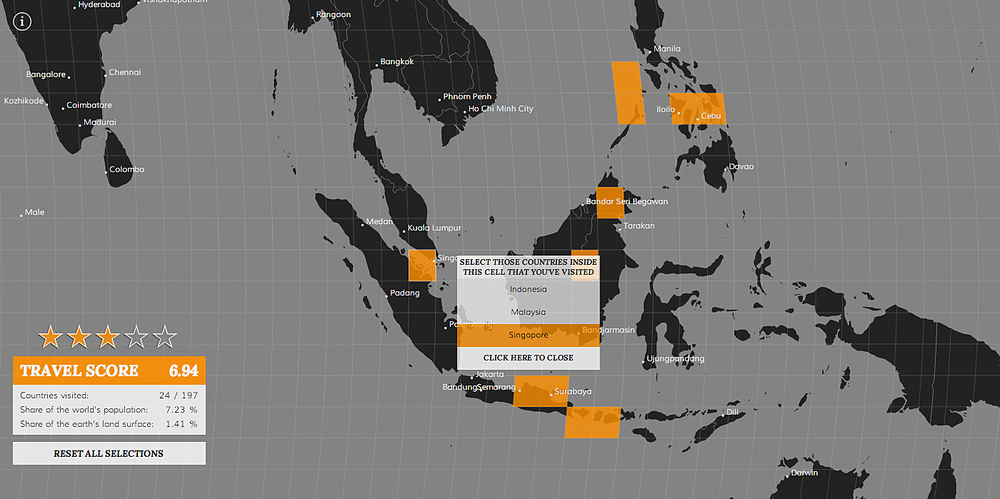
 BTW: My travel score is 6.91…still a lot to explore! what’s yours?