The German election campaign steps into it’s final phase. On September 22th the Germans will elect their new Parliament.
During the weeks before the election maps, graphics and data visualizations are probably more widespread in the media than at any other time. Consequently there’s a peak in the demand for data driven journalism every four years. We want to contribute to the coverage and therefor release a map that focuses on one single aspect: the nonvoters of the last federal election.
The basic idea behind our map is to raise awareness to the number on nonvoters by visualizing turnouts for certain areas in another way than by the ordinary choropleth map. Our focus is not on the percentage of nonvoters but on the sum and spatial distribution of individual persons that did not vote.
![]()
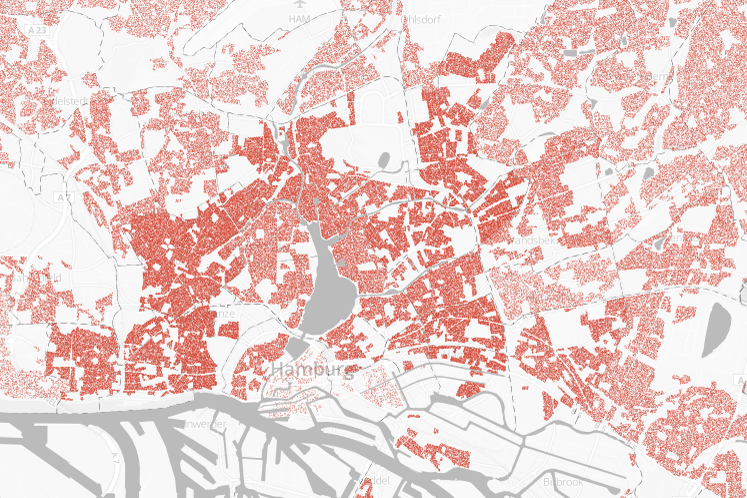
That’s why we chose to use a dot density map, displaying one point for every ten nonvoters during the 2009 election. For our home state Hamburg we were able to get more detailed data and realized a second version with higher zoom levels, displaying one point for every single nonvoter. Of course the points do not represent real persons and their home address. Moreover, the exact location of every point was determined by a random distribution of all nonvoters in each district. For a closer & interactive look at our maps, as well as on how we realized them, take a look at our project page.