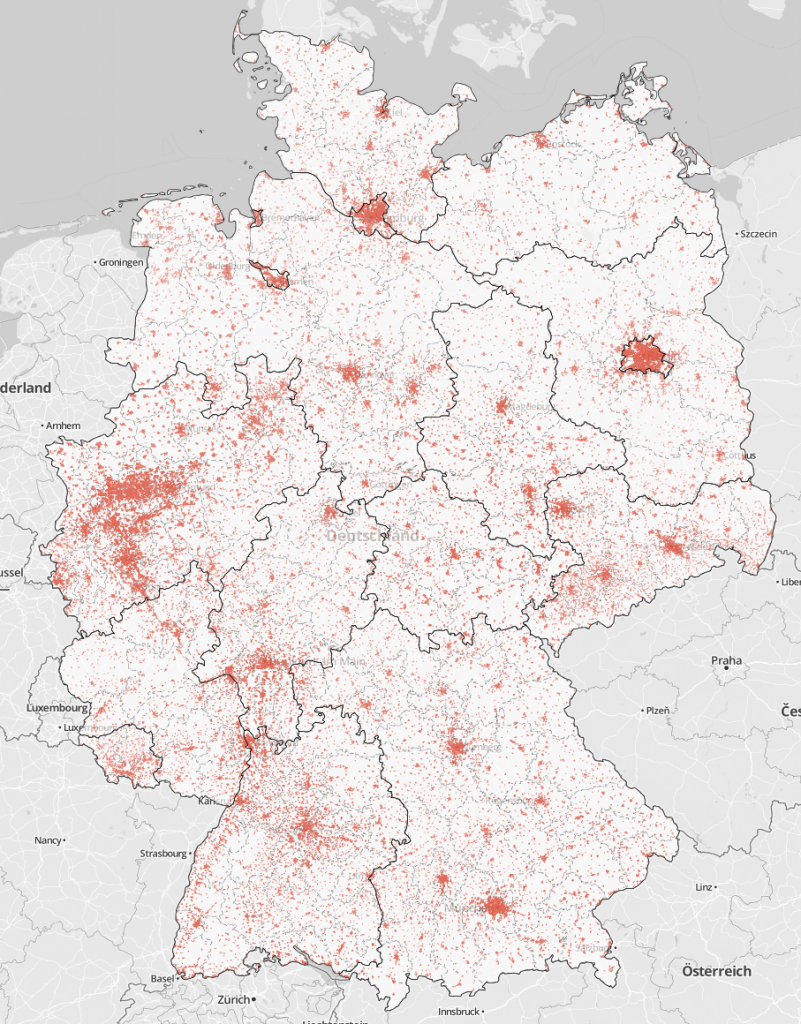
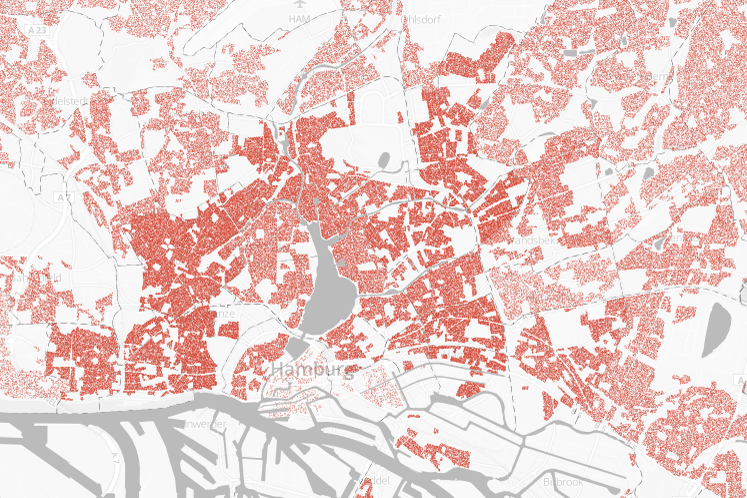
We’ve received a lot of (mostly positive) feedback for our last project “Atlas der Nichtwähler / The Geography of Nonvoters” which visualized the spatial distribution of nonvoters for the German federal election in 2009.
One weakness of the presentation was the lack of information about the relative number of nonvoters for each voting district. Basically, by mapping every nonvoter we produced a map which looks almost the same as a visualization of the current population density.
As a consequence we’ve decided to vary the style of our map for the results of the 2013 election by additionally displaying the percentage of nonvoters for each district by diverging colors.
The results are quite interesting: More than two decades after the reunification there is still a significant gap between voters in the eastern and western parts of Germany. Especially rural parts of eastern Germany have a considerably low turnout. This is sad but in no way surprising given their demographic, economic and social situation. The refusal to cast a vote is directly connected to factors like wealth and education. The suburban regions around cities like Berlin, Hamburg or Munich therefore show higher turnouts.
Interesting and somehow surprising is the fact that some counties in Bavaria had quite low turnouts as well. Maybe voters were overly convinced that the CSU-party (who received over 50 % of the votes in Bavaria) would win anyway.

